Dirty Pool
A Full-fledged Simulation for Selfish Mining in Bitcoin
Selfish mining.
In year 2010, user RHorning described the idea of selfish mining in the Bitcoin forum bitcointalk. The forum user provided simulation results for the attack, at the time called the mining cartel attack. Later in 2013 the term selfish mining and its formal description was introduced by Cornell researchers Emin Gün Sirer and Ittay Eyal in the paper Majority is not enough: Bitcoin mining is vulnerable.
The selfish mining attack is a method for mining pools to increase their returns by not playing fair.
The selfish miner continues to mine the next block but not broadcast it. They continue to do so maintaining their lead. This way there would be a hidden fork in the blockchain which can only be seen by the selfish miner. When the rest of the network is about to catch up with the selfish miner then the selfish miner releases their portion of solved blocks into the blockchain.
The result is that their chain and proof of work is longer and more difficult so the rest of the network adopts their block solutions and they claim the block rewards.
Stubborn mining.
After introducing selfish mining some further researches showed that more generalized selfish mining strategies could be even more profitable.
for example Theoretical Bitcoin Attacks with less than Half of the Computational Power (draft)
and specially Stubborn Mining: Generalizing Selfish Mining and Combining with an Eclipse Attack
provided a comprehensive generalization of selfish mining and also introduced different names for each of its variations:
Lead Stubborn Mining Strategy
A Lead Stubborn Miner waits until the honest miners catch up with him to broadcast all of his secret blocks as opposed to the selfish miner who does not take the risk of being caught by the honest miners and broadcasts his blocks if his advance shrinks to one block.
j–Trail Stubborn Mining Strategy
trail Stubborn Mining is an amelioration of Lead Stubborn Mining. When a trail Stubborn Miner's private chain falls behind the public chain, they may decide to continue mining on it anyway, in the hope of catching up. We consider a family of trail stubborn strategies parameterized by a threshold j, such that a j–trail stubborn miner accepts the public blockchain only when their private chain falls behind the public chain by j + 1 blocks). So by definition the 1–trail stubborn mining is the same as lead stubborn mining. Here we study only 2–trail, 3–trail and 4–trail stubborn mining since the other trail stubborn strategies can be easily dominated by other strategies.
Equal Fork Stubborn Mining Strategy
An Equal Fork Stubborn Miner waits for the official blockchain to overcome his secret fork by one block. He/she only gives up when the length of the official blockchain is equal to the length of his secret fork plus one.
Try it yourself.
Of course these strategies are not generally more profitable than the honest mining strategy. For example if you own even a 25% hash rate share of the network (which is usually denoted by α), being a selfish miner would never be more profitable than being an honest miner unless for some reason more than half of the other miners chose to mine on the fork you have created (which is usually denoted by γ).
If you are interested in seeing when you can exploit the network by being a selfish or a stubborn miner in the next section you can find a simulation of these strategies. You can change the sliders and click the simulate button to see that in comparison with an honest miner, which strategy is more profitable and by how much.
This is a simulation based on a random number generator used in the simulation of mining a block, so every time you push the button the results would be a little bit different.
So- α is your hash rate share of the network.
- γ is the proportion of honest miners who mine on the fork you created.
- n is the number of attack cycles you're willing to perform.
Simulate.
In other words
- NOTE : If you set n very low, selfish and stubborn strategies won't be more profitable than being honest, no matter how high your α and γ are (because before first difficulty adjustment profitability of selfish and stubborn mining are always less or at best equal to honest mining).
*The simulations are open-source and available on the DirtyPool, repository of the website.
Let's Visualize.
There have been previously different simulation approaches such as
- Majority Is Not Enough: Bitcoin Mining Is Vulnerable
- Optimal Selfish Mining Strategies in Bitcoin
- On the Security and Performance of Proof of Work Blockchains
- Stubborn Mining: Generalizing Selfish Mining and Combining with an Eclipse Attack
- Impact of Bitcoin protocol complexity on simulation output,
- Natural occurrence of forks and orphaned blocks in the network,
- Time-related parameters (duration of the attack, network delays, difficulty adjustments),
Here we provide the results of a new simulation which overhauls the previous flaws in order to study the profitability of these strategies. Unlike previous simulations, attack duration and network connectivity have been considered as crucial parts of the simulation. The method used in such a simulation models a peer-to-peer network of miners with different hashrates, mining blocks while adopting different strategies, in contrast to previous attempts which were based on finite-state machine.
The simulation you find on this website is based on finite-state machine, just like previous works (such as Stubborn Mining: Generalizing Selfish Mining and Combining with an Eclipse Attack) which lacks the implementation of time, therefore cannot be used to calculate time before profitability but at least it's fast enough for the user to interact on thge website. To analyze time we need another type of simulation. By simulating a peer-to-peer network we can achieve this, since this way we have a real network and different nodes to simulate different mining strategies but unfortunately it's not fast enough for the user to include on the website, therefore we provide only the results of this simulation, although the code of the simulation is available* online on the githup page of the site.
*The simulations are open-source and available on the DirtyPool, repository of the website.
Study of time before profitability is not the only advantage of a peer-to-peer network simulation, study shows the resaults obtained by such simulations are much more reliable. Here you can see some finite-state machine simulations and compare the resutls with a peer-to-peer network simulation.
In each diagram each color means in that zone the correspoding strategy performs better than other strategies.Below you see how a peer-to-peer network simulation can more reliable since the accuracy of the results is not as dependent on the number of runs of the simulation as finite-state machine simulations.
Let's add another dimension.
By considering the Apparent Hashrate as the third dimension we can better understand why there is not a dominant strategy for any choice of α and γ. To do so for each strategy we consider a surface which for any choice of α and γ shows the apparent hashrate (α') of the strategy. Take a look at this visualization to understand better.
Now we can compare the expected results based on On Profitability of Selfish Mining and our simulation including the apprent hashrate.
(*You can rotate the 3D models.)
Honest mining Surface.
Selfish mining Surface.
Honest & Selfish mining against each other.
All the strategies against each other.
Simulated results.
Number of Difficulty Adjustment.
Time analysis of the attack cycles as previously mentioned in the introduction has been initially considered in On Profitability of Selfish Mining. They proved an unprecedented property of a network including a block withholding strategy; no strategy is more profitable than the honest strategy before a difficulty adjustment. This means there would be no benefit of adopting a block withholding strategy in short term no matter how high is your hashrate share or propagation factor, since the attacker has to wait for the difficulty adjustment to start its profit. Apparently, the block withholding strategies exploit a flaw in the difficulty adjustment formula since the parameter used to update the mining difficulty is supposed to measure the actual hashing power of the network and In the presence of a block withholding miner, this is no longer applicable.
If we consider the number of difficulty adjustments as the third dimension then we get this visualization.
In the next visualization we see the optimal strategy before and after the difficulty adjustment, based on analytical results of On Profitability of Selfish Mining on the left, which shows these strategies can only become profitable after the difficulty adjustment, otherwise, honest mining will remain the optimal strategy. Now let’s compare that with the results obtained by our peer-to-peer simulation. You see on the right we included the exact diagram of our simulated results which you see earlier but this time in different sections of increasing mined blocks, specifically each section is exactly one block behind the next difficulty adjustment to demonstrate the full impact of each adjustment.
Pre–Profitability Period.
After finding the winner strategy in the previous section, it's very important to realize which strategy leads to profit in a shorter time period. The time before profit or pre-profitability period is the minimum time for a strategy such that the number of blocks mined by the selfish miner in the official blockchain would be greater than the average number of blocks mined by the miner if they chose to mine honestly from the beginning. You can read more about this in On Profitability of Selfish Mining.
Now let's compare the simulation results* with the findings of the On Profitability of Selfish Mining specially the part related to time before profit.
* The following results come from another more sophisticated simulation that the one you find on this webpage.
The minimum time in which the attacker becomes profitable has been studied in On Profitability of Selfish Mining for the first time. It means the duration of time in which the attacker overcomes the honest miners. Such an analysis of time was not possible using only Markov models. The authors used their new approach to model the duration of the attack cycles and consequently they could compute that how long it would take for the selfish mining strategy to become profitable, as the previously proved such a block withholding strategy is not profitable at the beginning before any difficulty changes.
Based on On Profitability of Selfish Mining, After validation of blocks, Bitcoin's protocol modifies mining speed by a factor of where is the time needed to validate the blocks with min, and for we have where is the hashrate of the selfish miner and is the hashrate of the rest of the pool. In this case we have always Therefore we can the time it takes the selfish miner to reach the next difficulty adjustment is Then the attacker will have to wait an additional duration before his attack becomes profitable. We denote by This way we can say he time in which the attack becomes profitable would satisfy where is the apparent hashrate of the attacker. In this case we always have
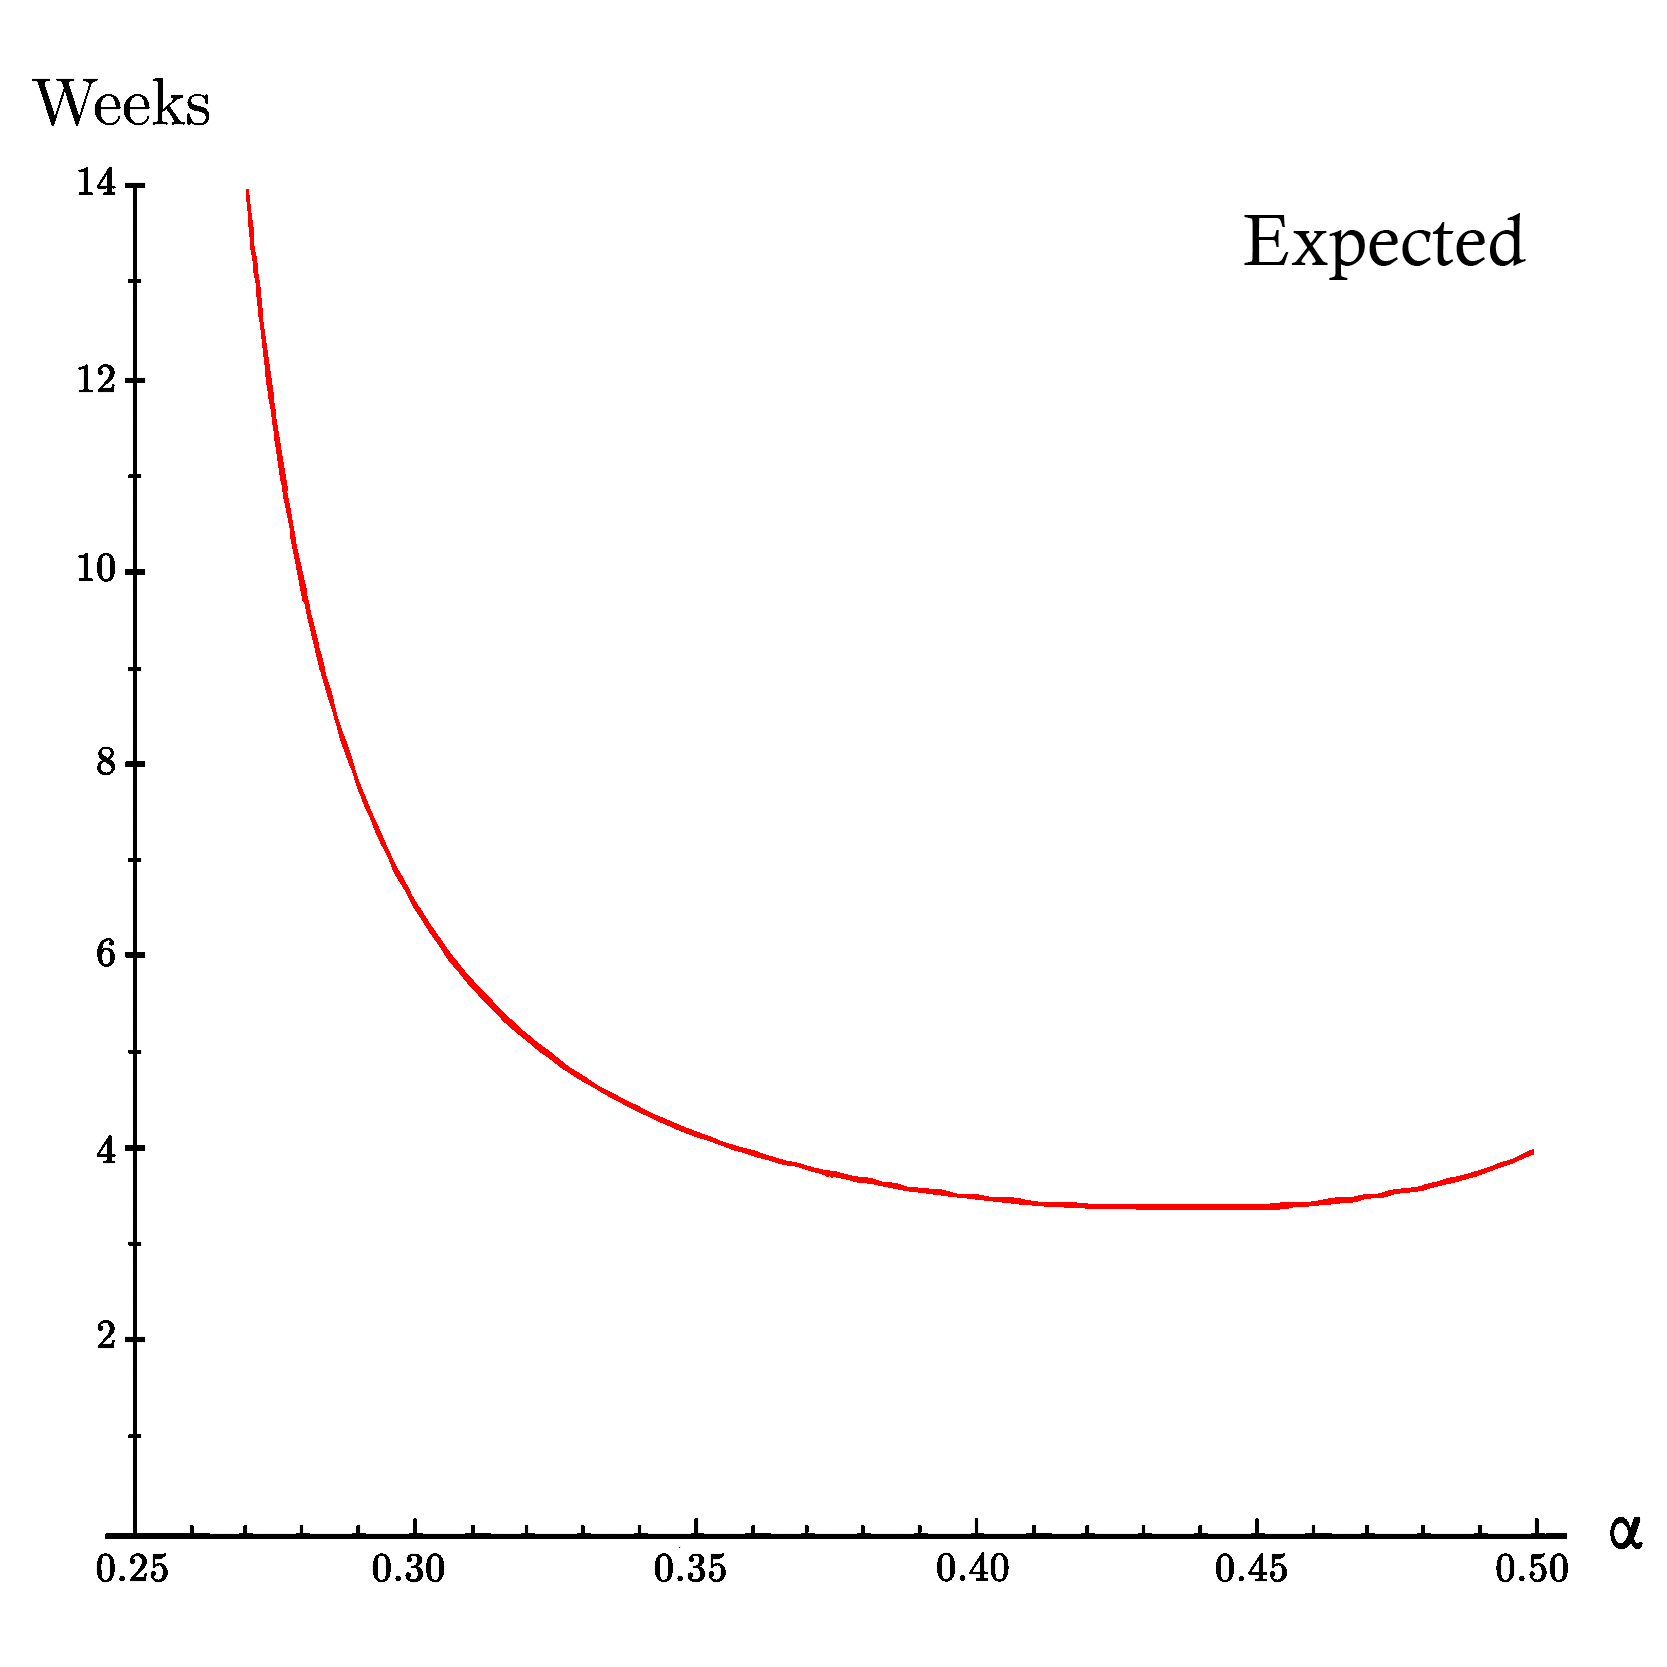
To uderstand better please head to the On Profitability of Selfish Mining, where you can find a lot more useful information about this section.Below you can see the diagrams of the equations above and we can then compare them with our simulated results. If we consider γ = 0.50 and compute the time after which the selfish mining strategy becomes more profitable than the honest mining strategy for different values of α, we'll see in the first figure (from On Profitability of Selfish Mining), the selfish miner needs at least 25% of the computing hash power of the pool (α ≈ 0.25) to start to overcome the honest strategy and by increasing the hashing power, the time it needs to surpass the honest strategy decreases until it reaches its minimum which is around three weeks and three days at the hashrate share of α ≈ 0.43. It is very interesting that after this point Increasing the hasrate share leads to a longer waiting period before surpassing honest miners so higher computation power does not always mean the profitability will be reached sooner. This could be the result of the greater distance between the apparent hashrate of the mega-powerful selfish miner and the honest miners because it needs a lot more work to surpass honest miners by a huge margin rather than a small one. Another interesting point in this study is, increasing the hashrate share of the selfish miner leads at most to the duration of four weeks, consequently for a propagation factor of fifty percent, there would be an optimum point for hashrate share of a selfish miner between twenty-five and fifty percent hashrate share which leads to a duration of fewer than four weeks.
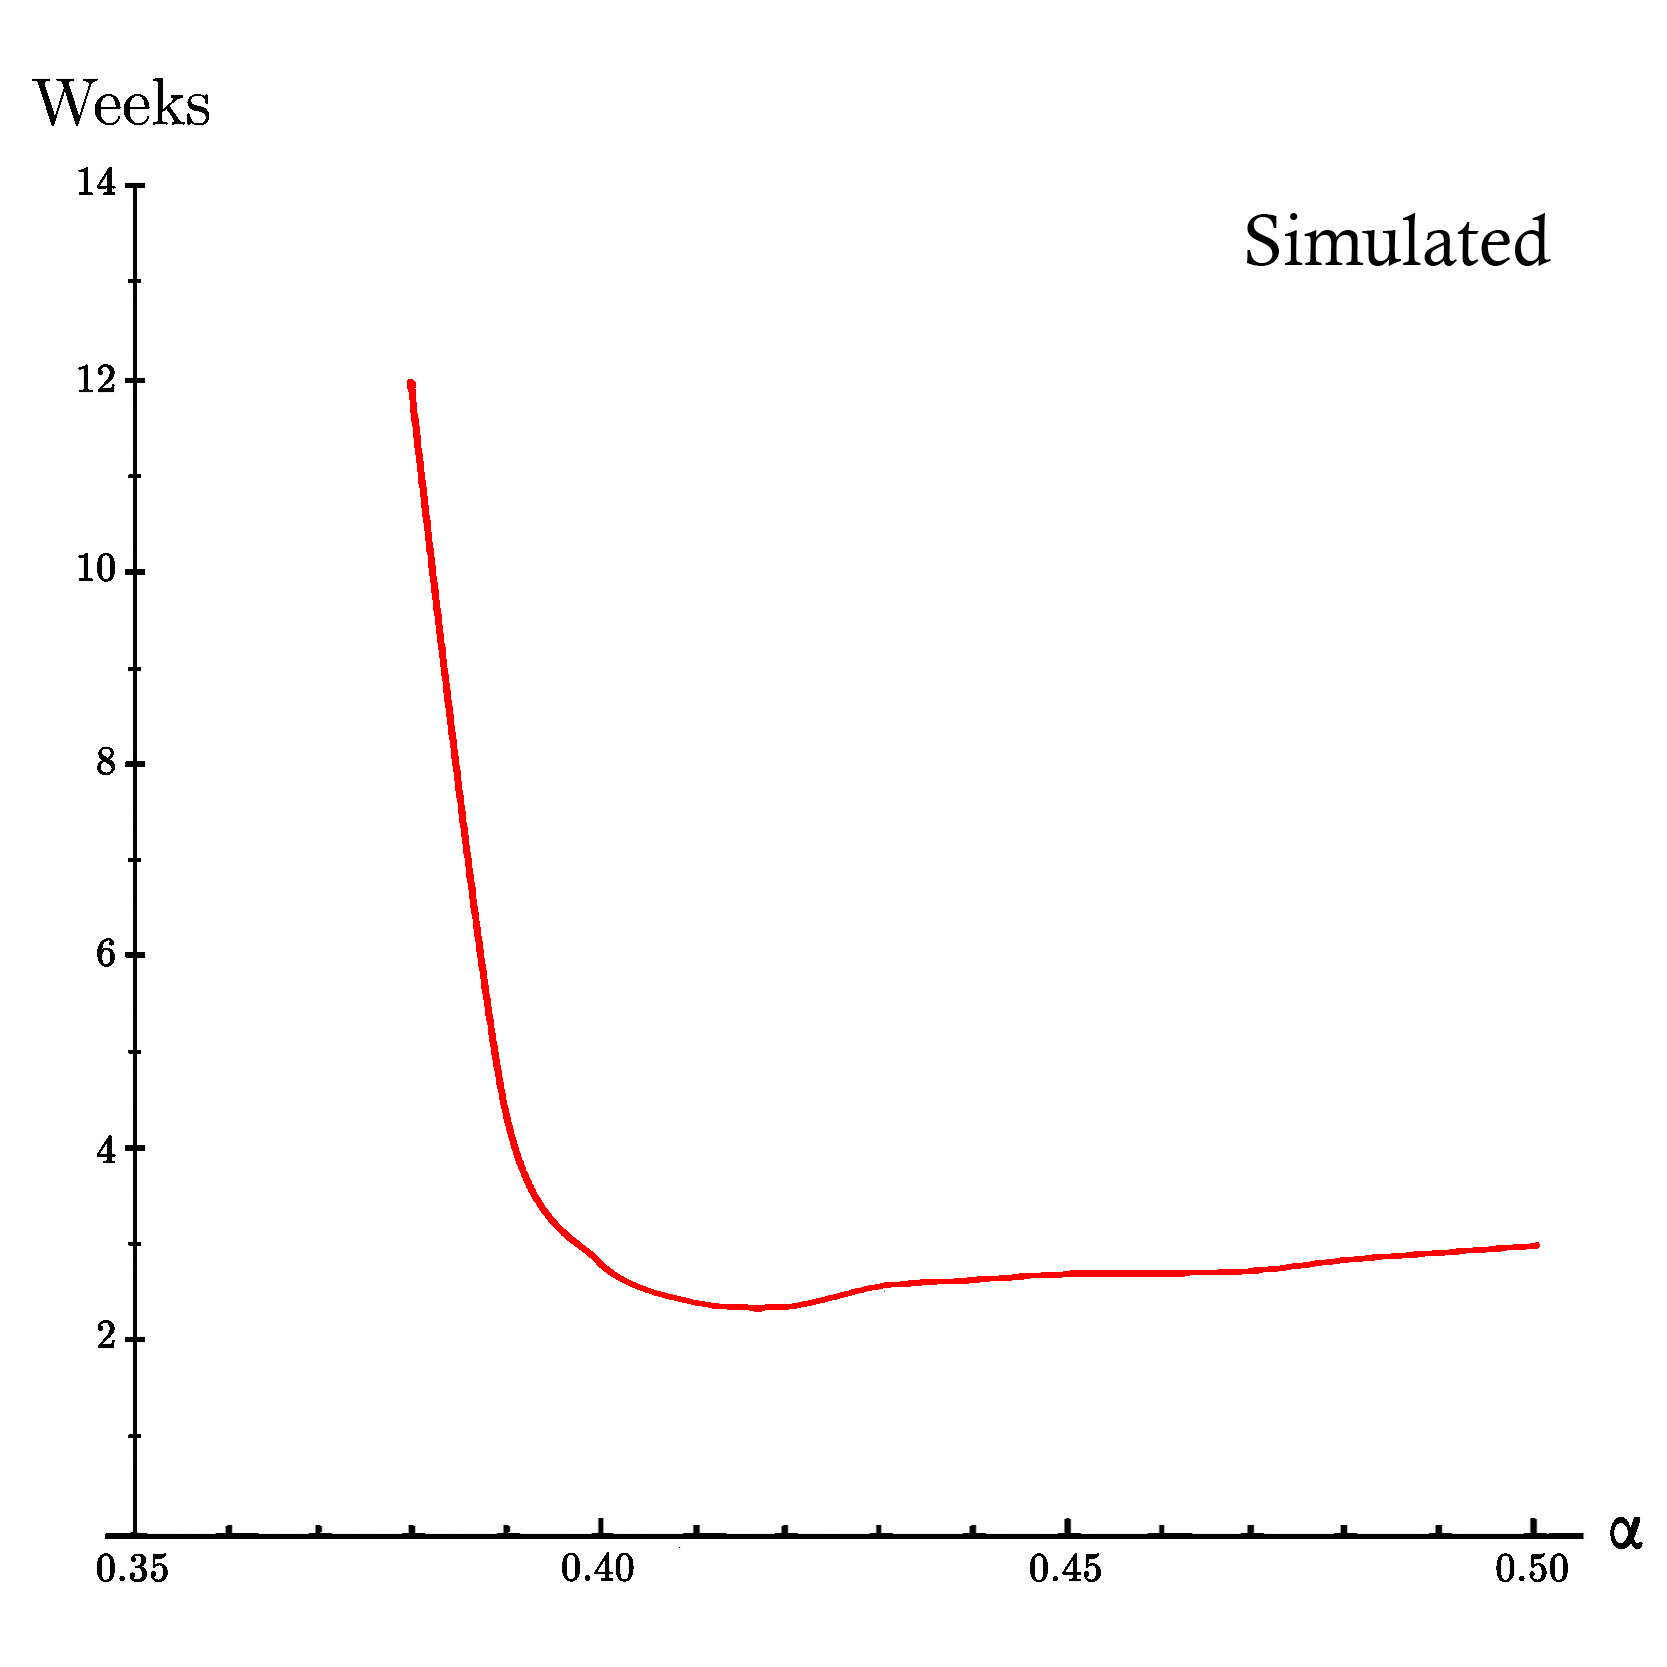
On the other hand in the second figure which is based on the results of our simulation, we can see the same pattern. Specifically, the minimum pre-profitability period occurs at α ≈ 0.42 in around two weeks and two days. In general, the pre-profitability period in the simulation is a little bit less than expected analytical results of On Profitability of Selfish Mining. This could be the result of the fact that the performance of the selfish mining strategy in action in terms of apparent hashrate (as you can see yourself in the simulation) the apparent hashrate of selfish mining strategy is lower than the expected analytical results of On Profitability of Selfish Mining and since it is easier for the attacker to achieve less apparent hashrate than more, the pre-profitability period can be shorter.Expected Time Before Profitability of Selfish Strategy based on On Profitability of Selfish Mining for propagation factor of 50% (γ=0.50).
Simulated Time Before Profitabilty of Selfish Strategy based on our peer-to-peer network simulation for propagation factor of 50% (γ=0.50).
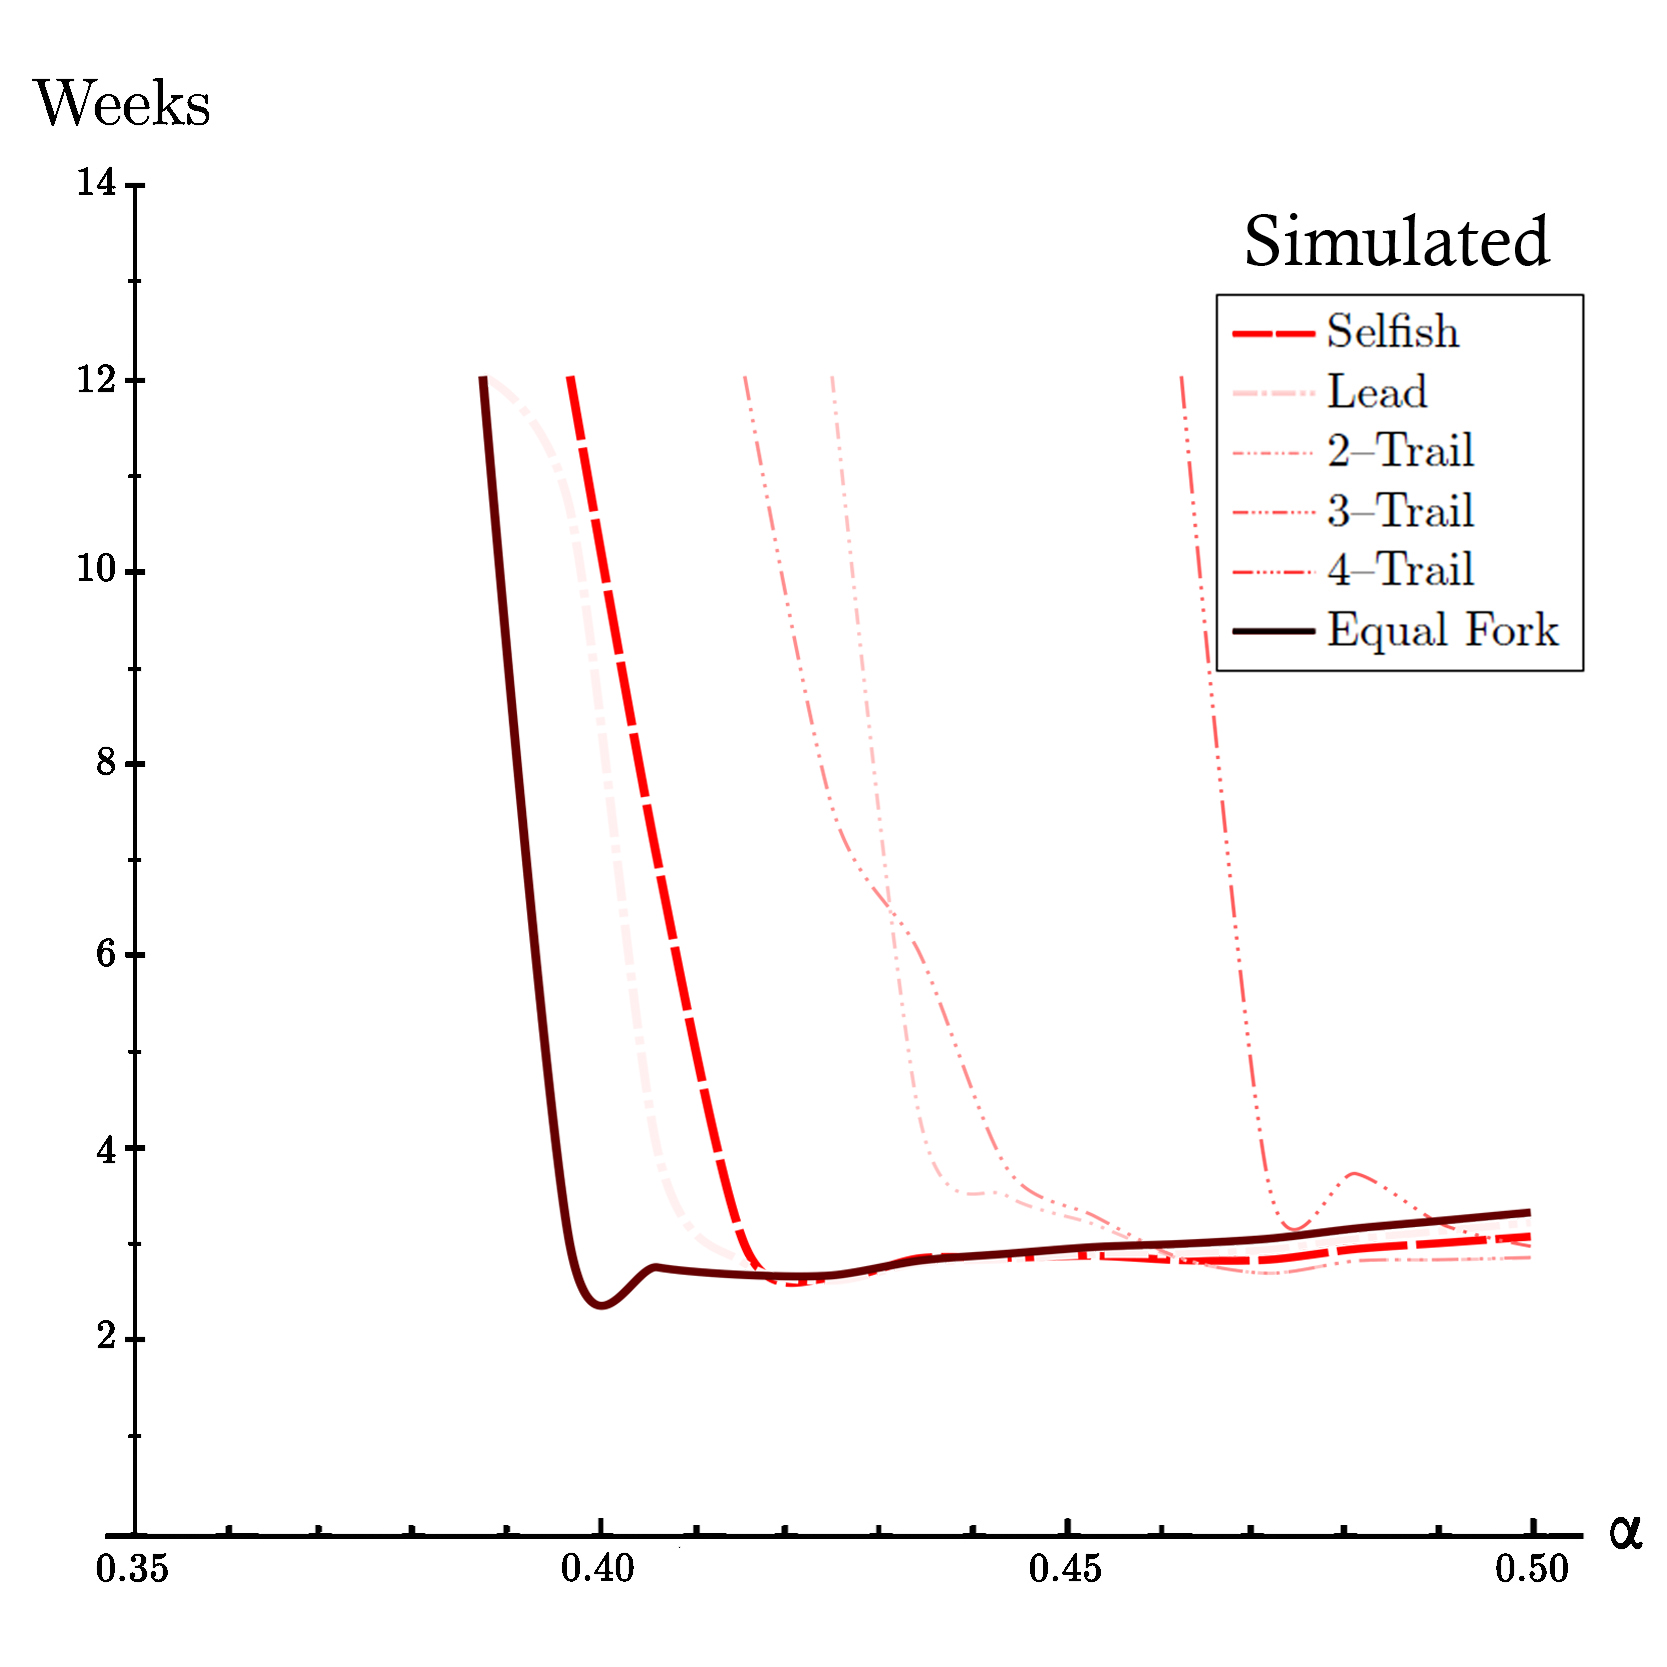
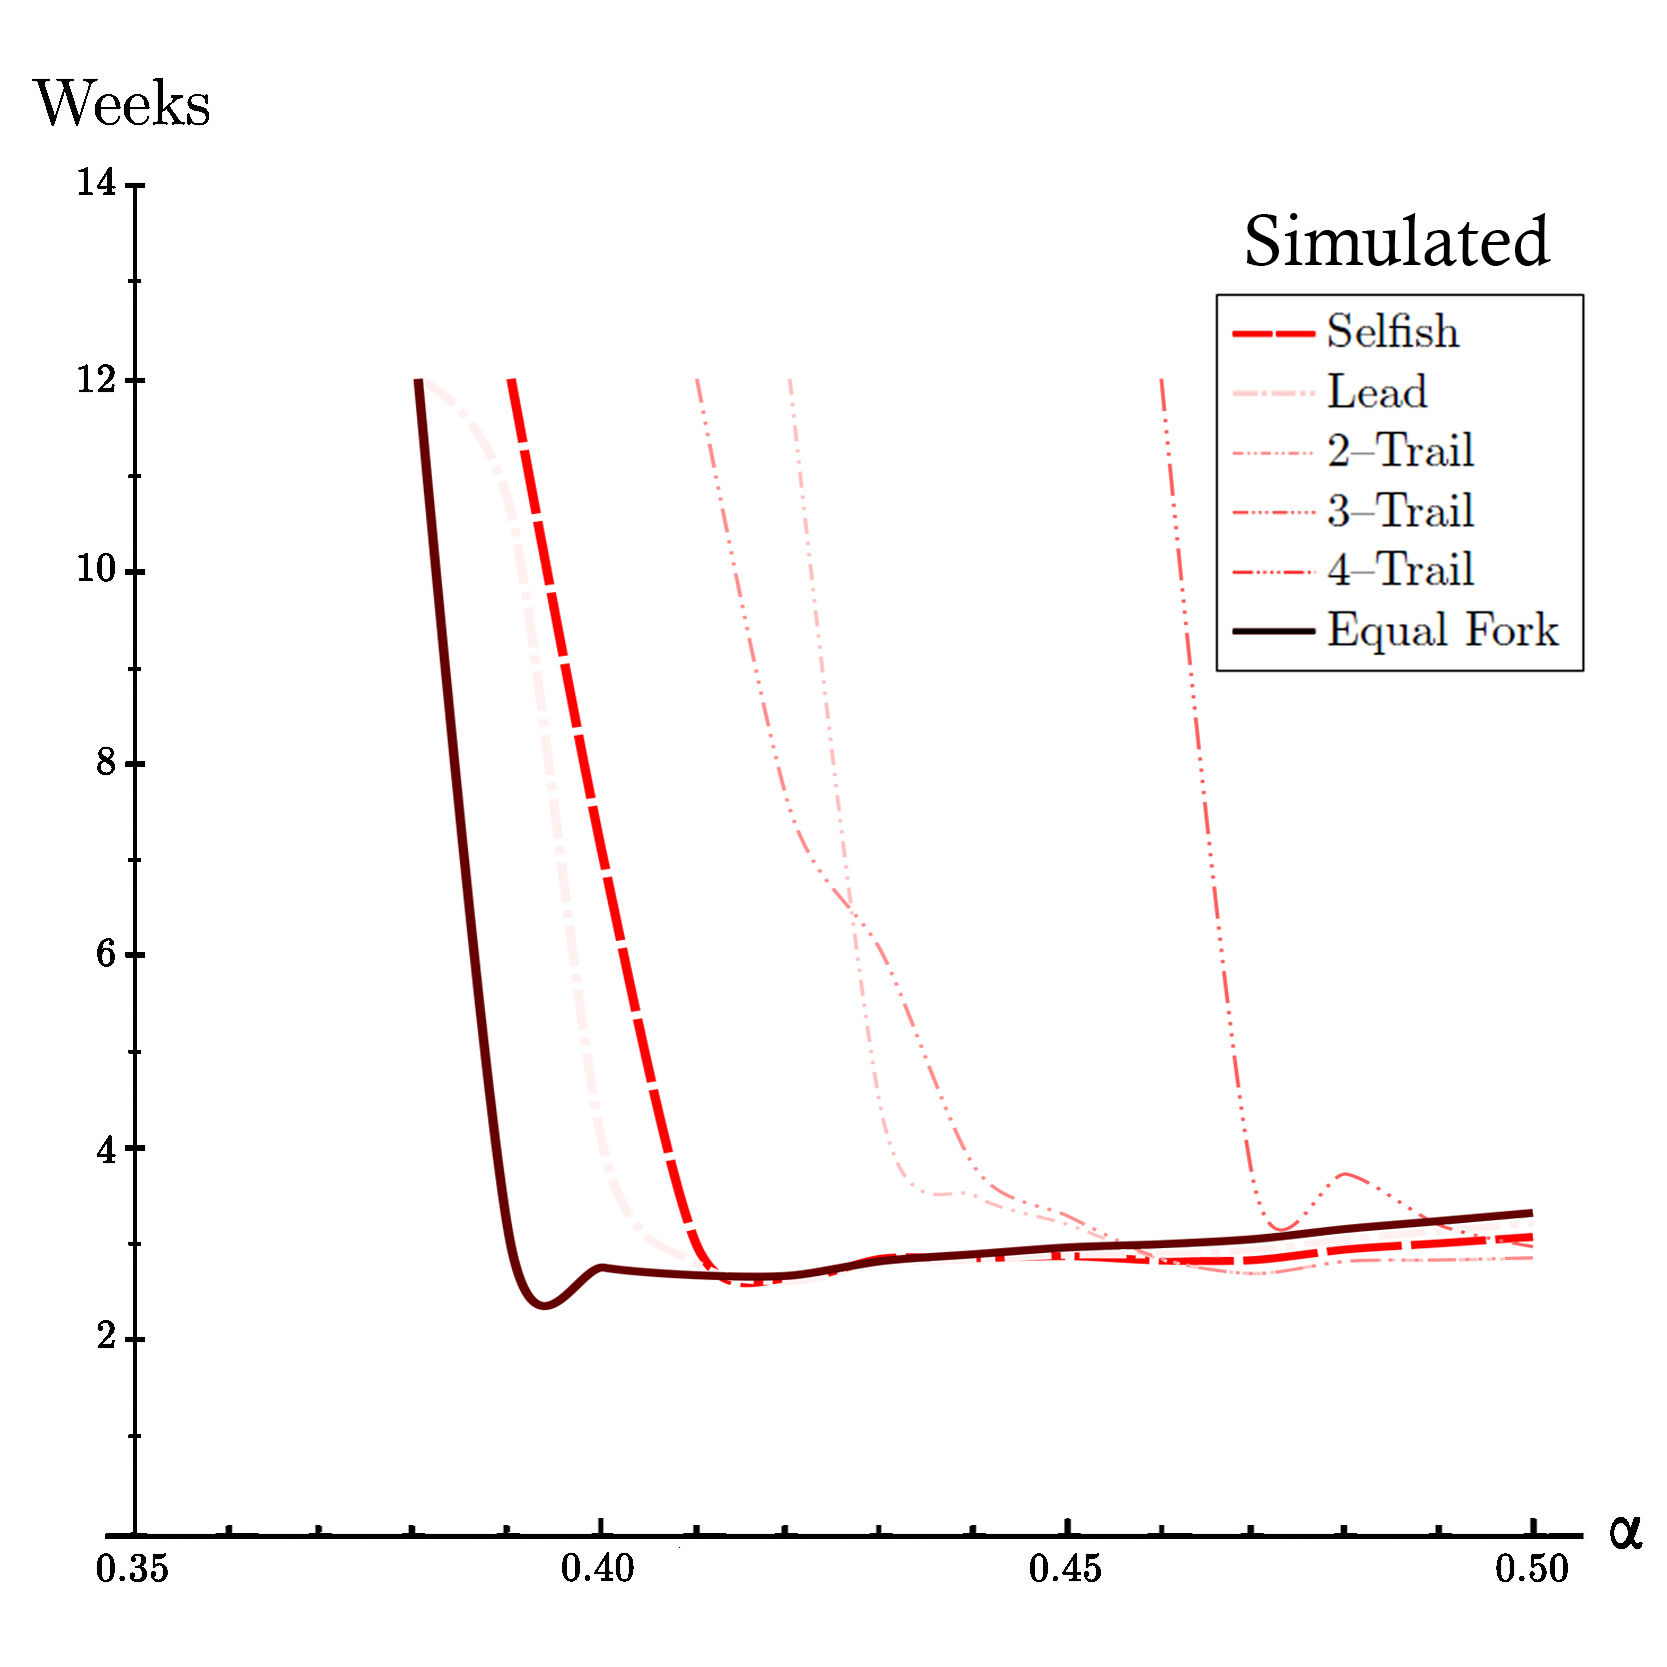
Simulated Time Before Profitabilty of All Strategies based on our peer-to-peer network simulation for propagation factor of 15% (γ=0.15).
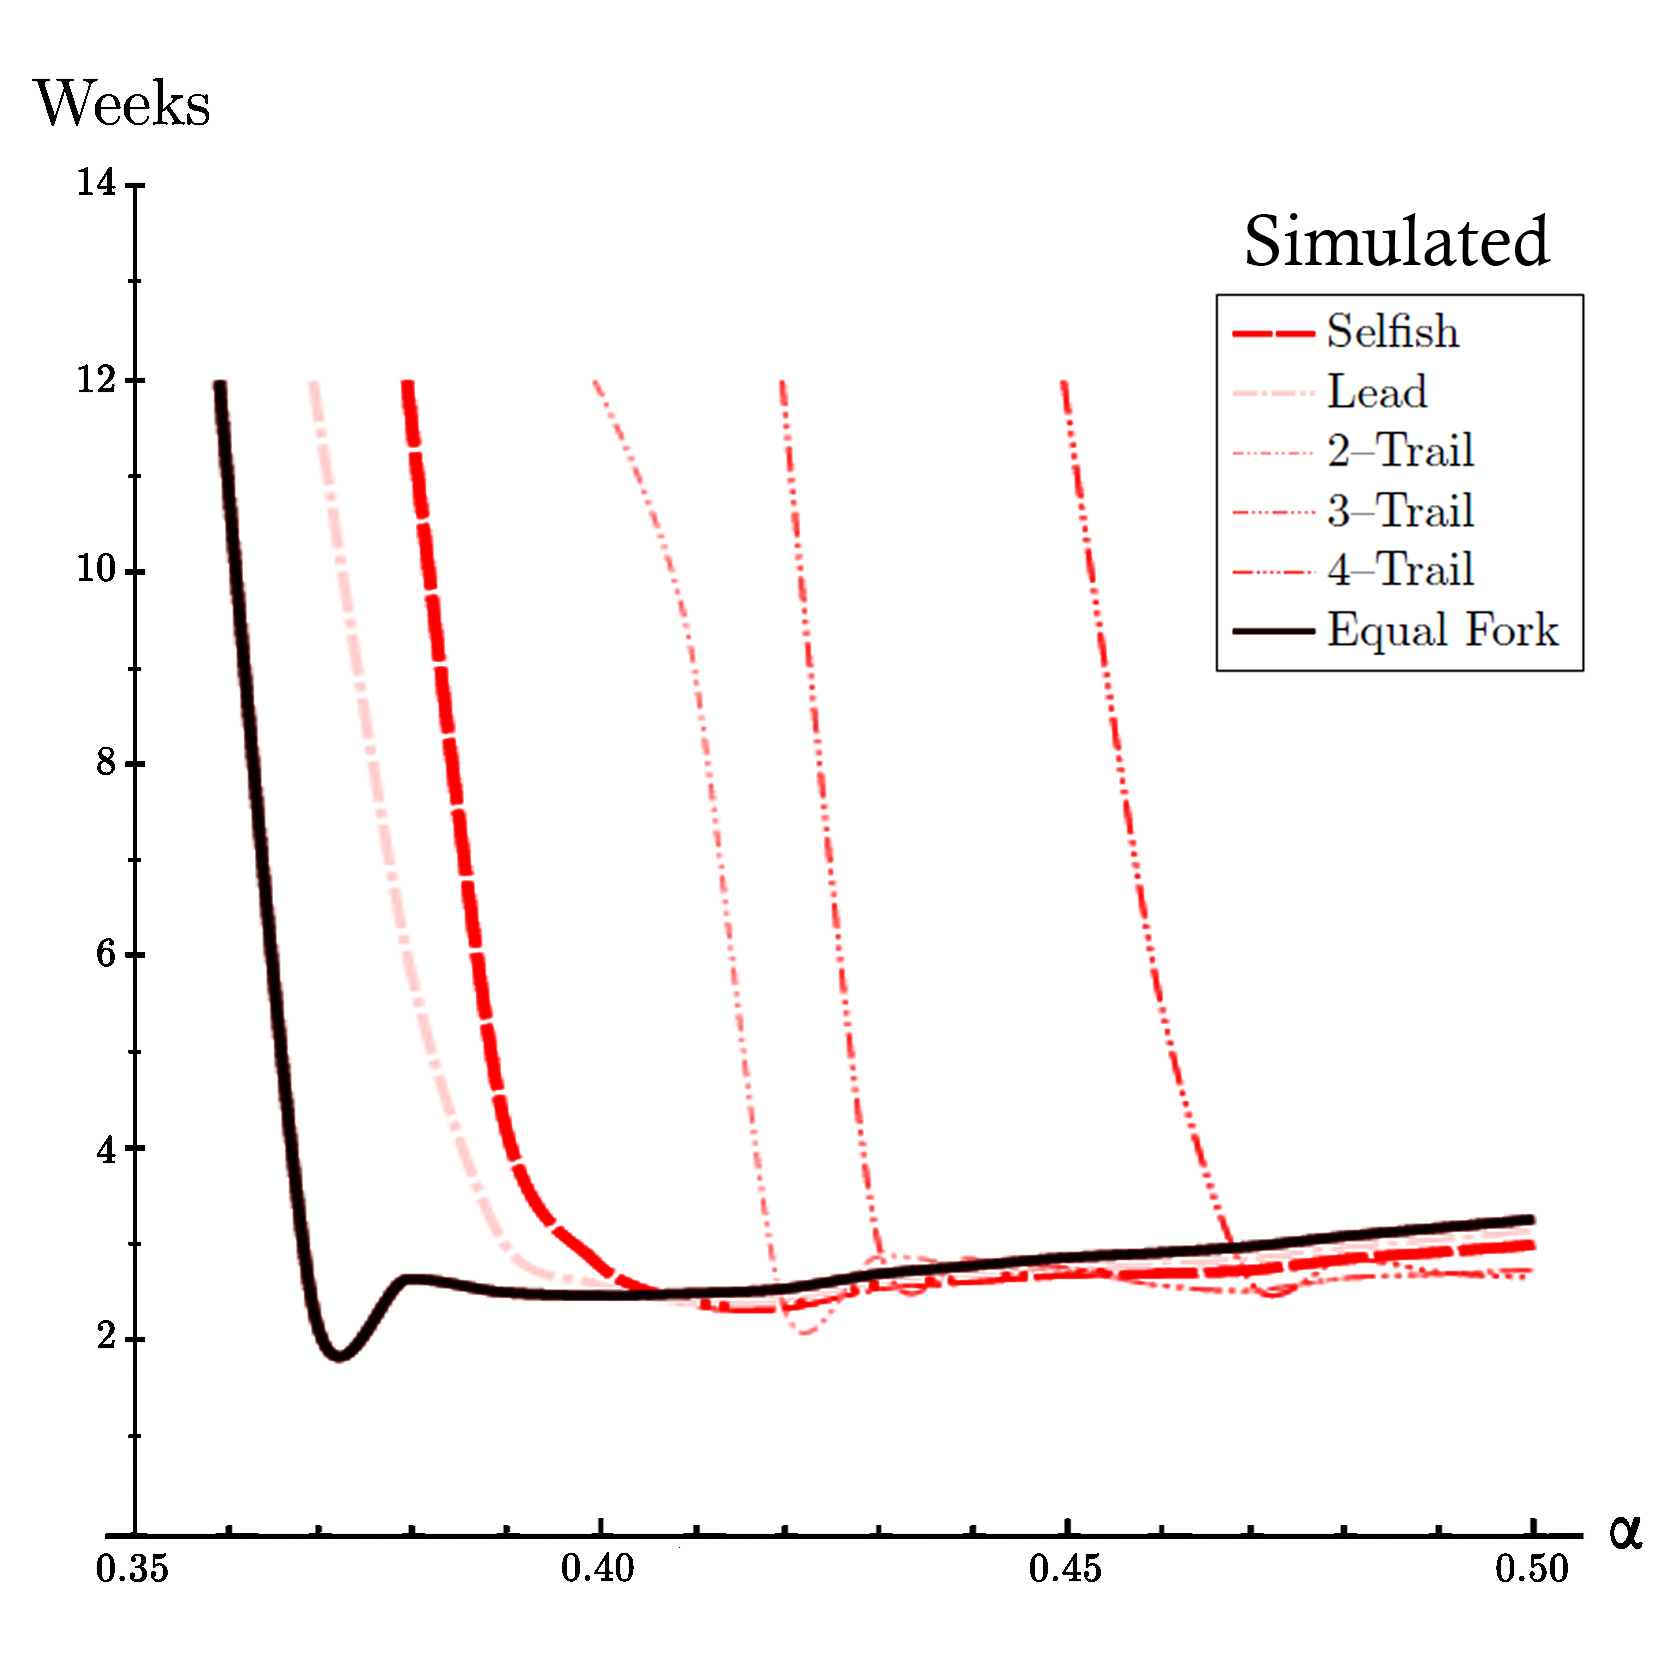
Simulated Time Before Profitabilty of All Strategies based on our peer-to-peer network simulation for propagation factor of 50% (γ=0.50).
Simulated Time Before Profitabilty of All Strategies based on our peer-to-peer network simulation for propagation factor of 85% (γ=0.85).
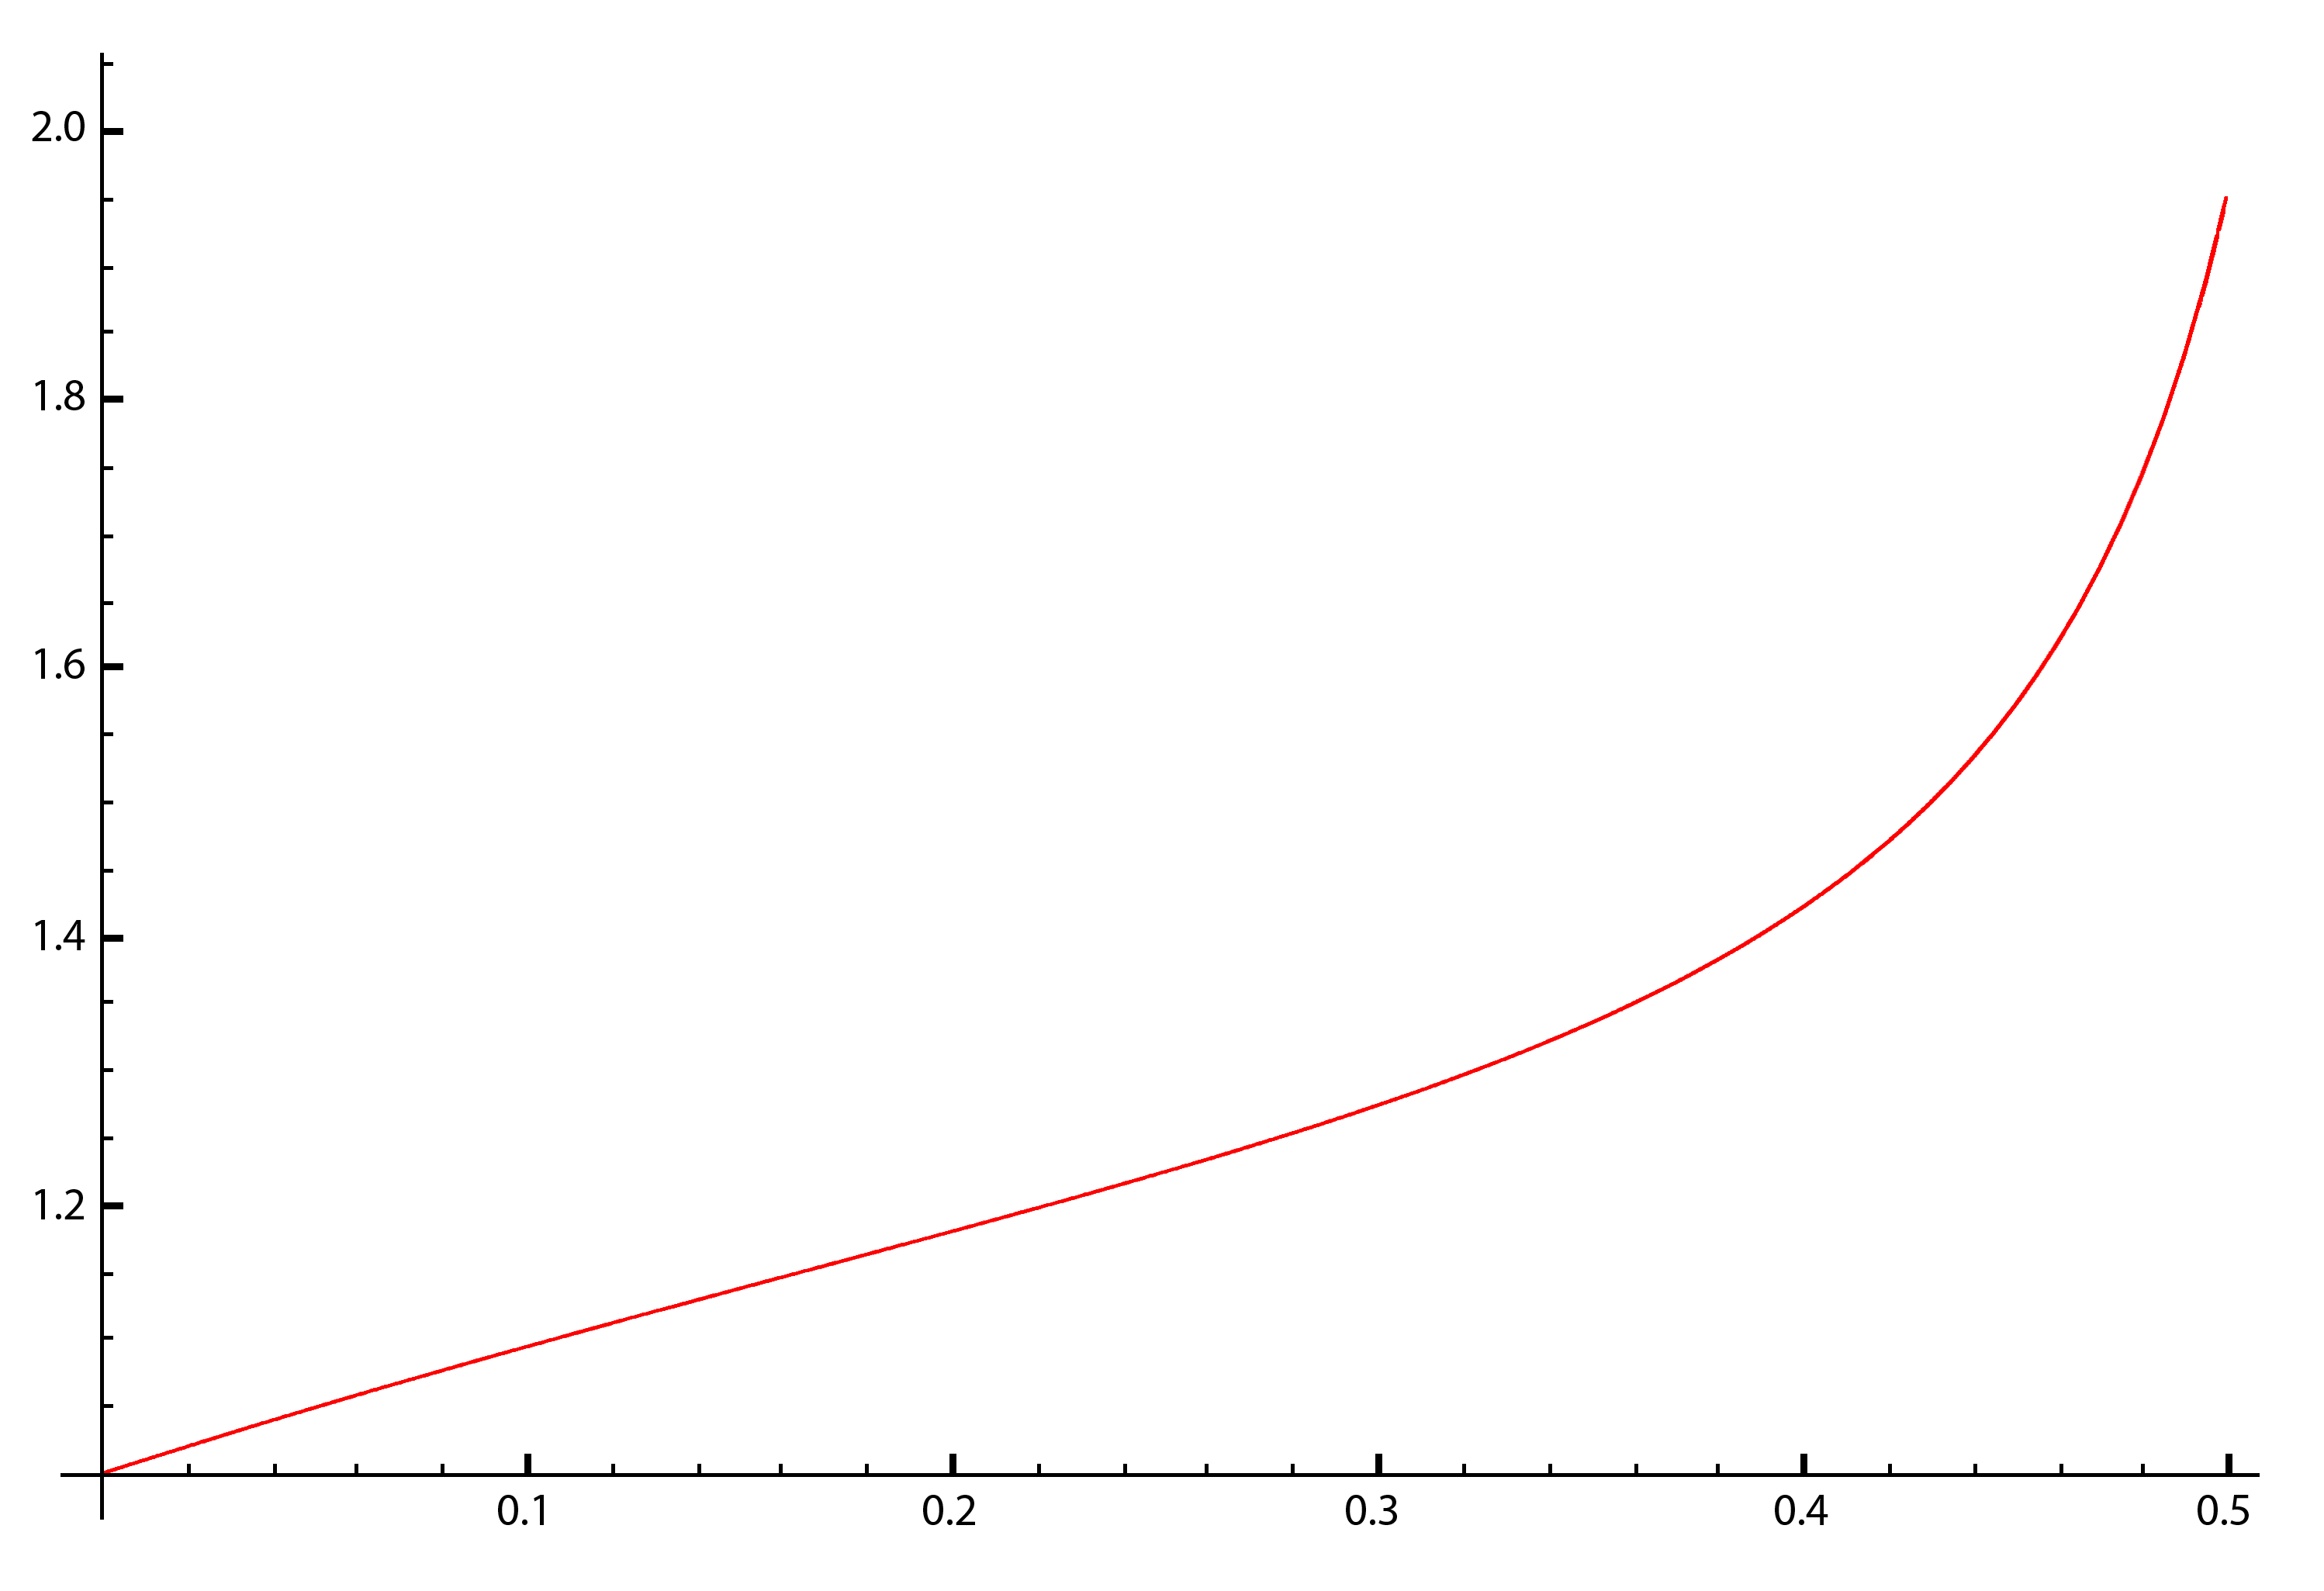
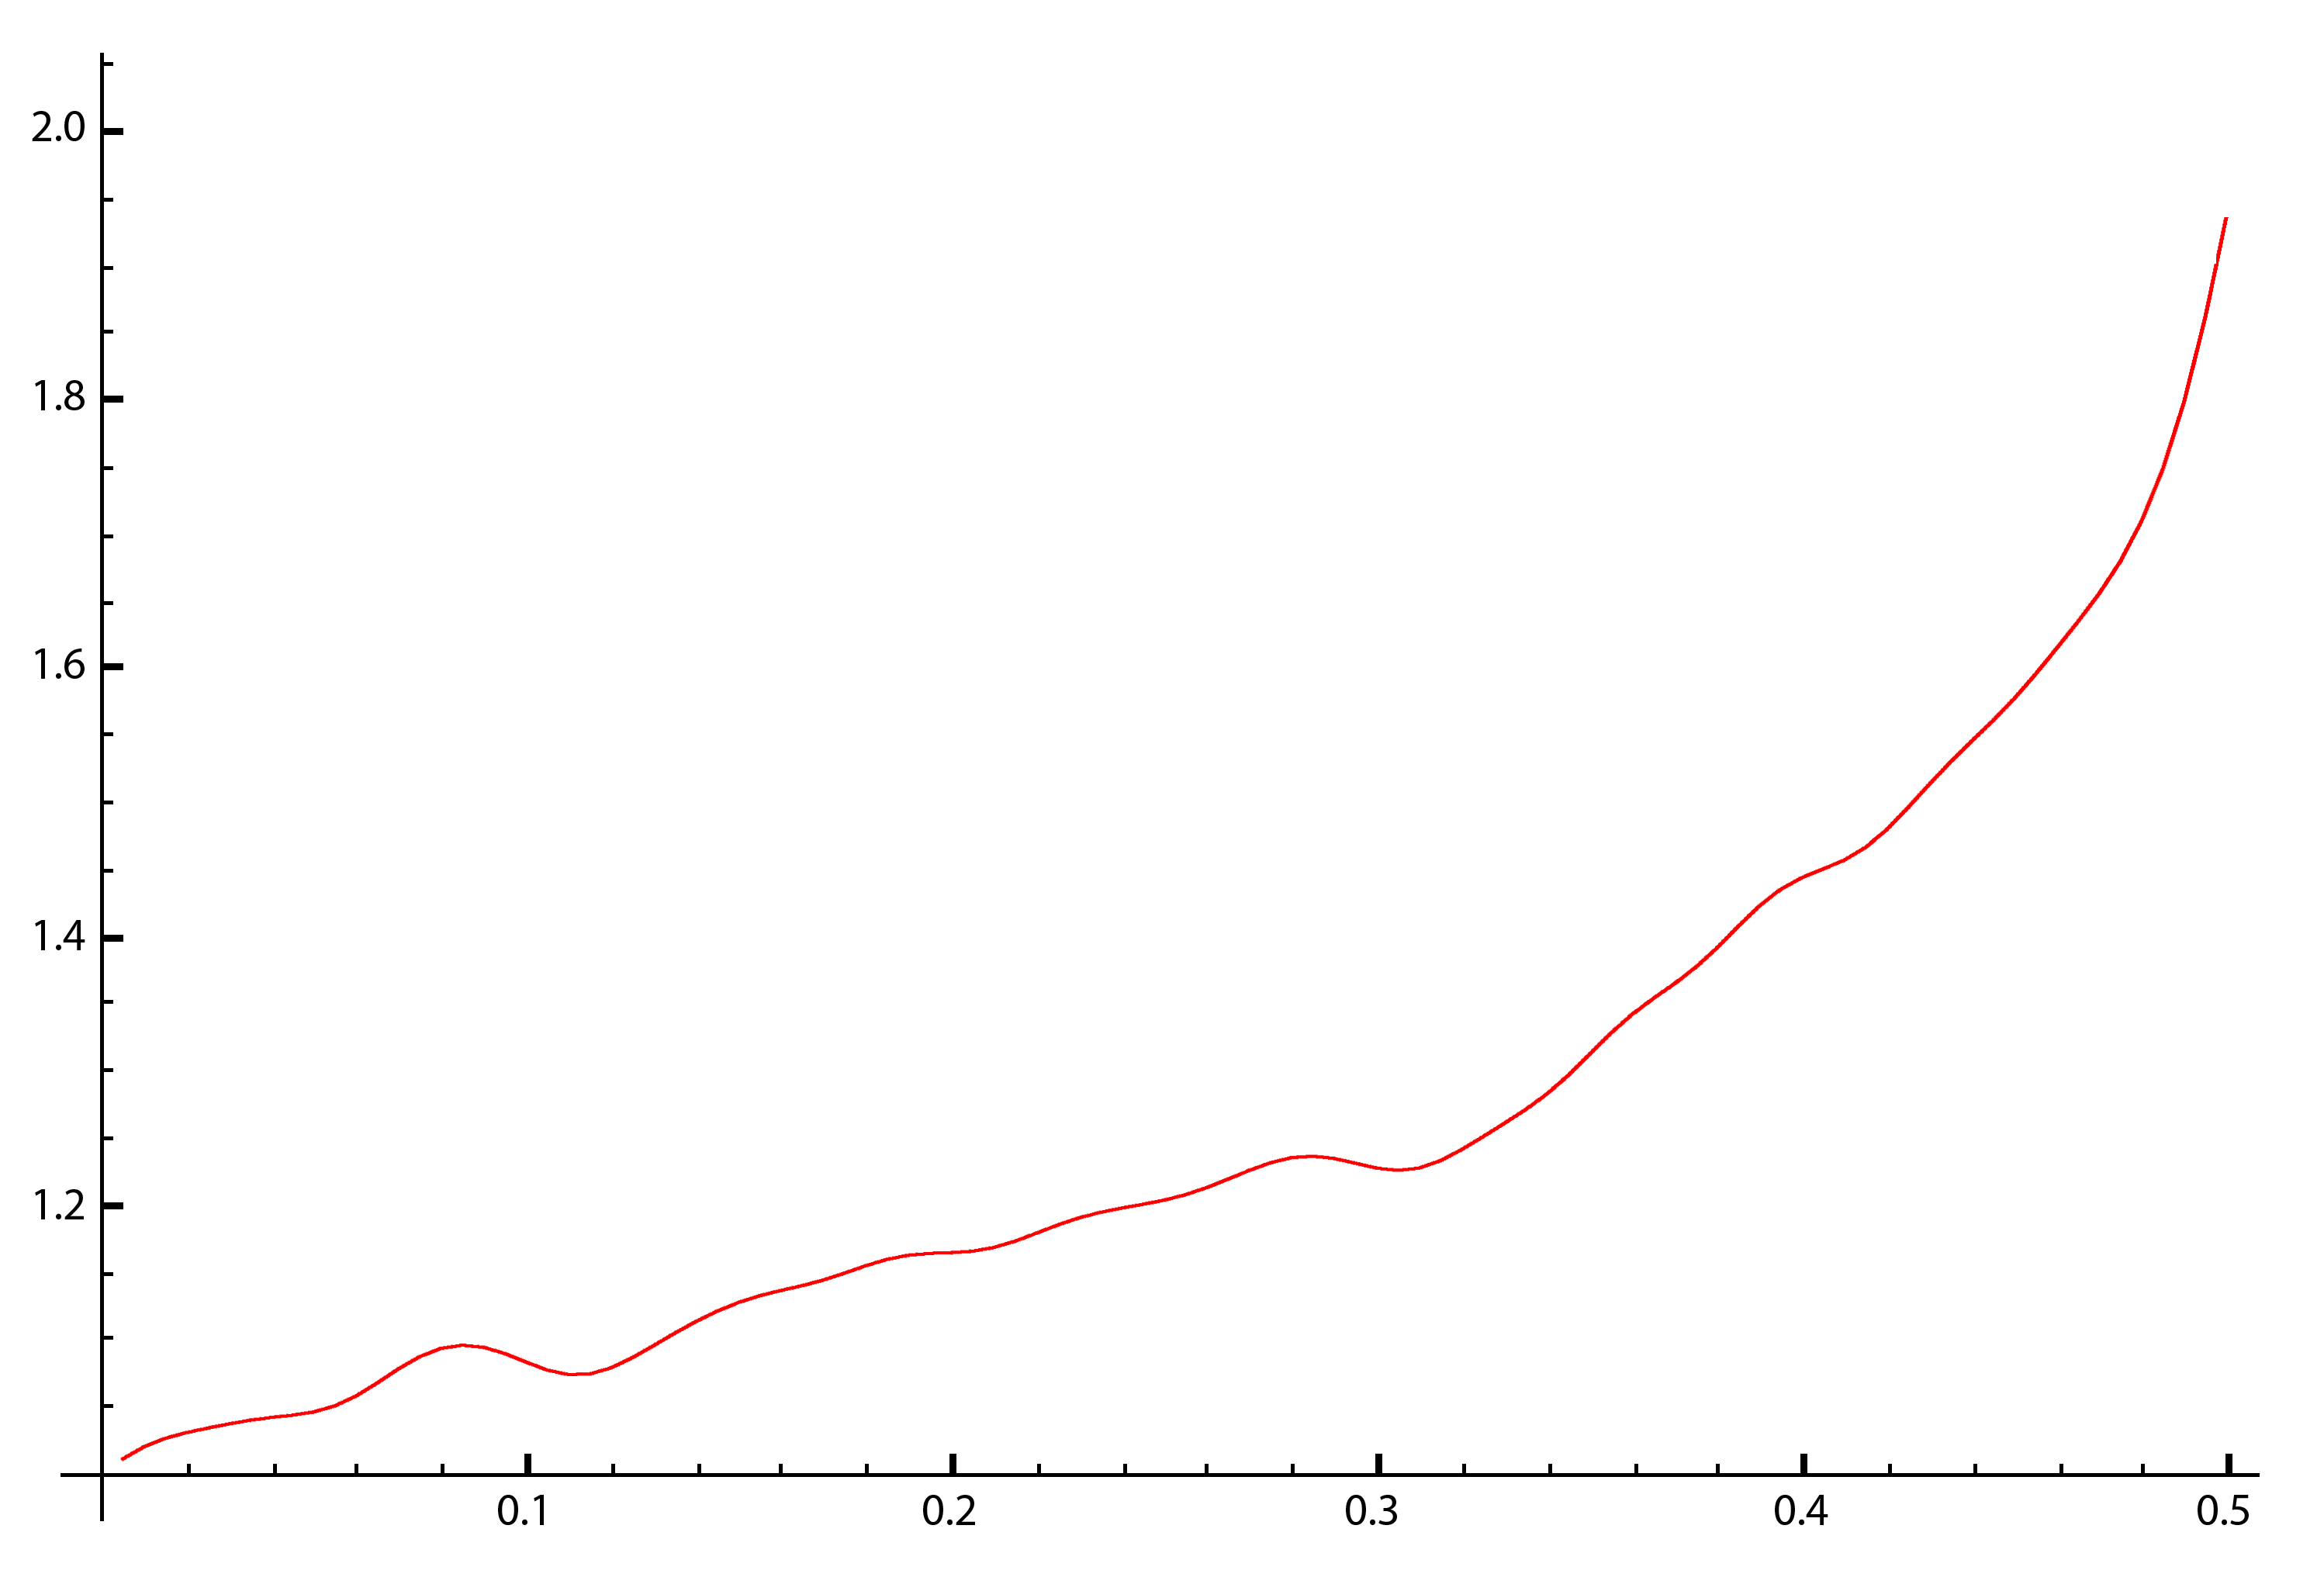
We can also compare difficulty adjustments of different strategies. To do so we use difficulty-hashrate diagram since the difficulty adjustment of selfish mining does not depend on the propagation factor (γ). To uderstand why you can read proposition 5.1 in On Profitability of Selfish Mining. Now let's takea look at expected results for selfish mining and compare it with the simulated data.
Expected Difficulty Adjestment for Selfish Strategy based on On Profitability of Selfish Mining for hashrate shares between 0% to 50% (α∈[0,0.50]).
Simulated Difficulty Adjestment for Selfish Strategy based on our peer-to-peer network simulation for hashrate shares between 0% to 50% (α∈[0,0.50]).
Simulated Difficulty Adjestment for All Strategies based on our peer-to-peer network simulation for hashrate shares between 0% to 50% (α∈[0,0.50]).
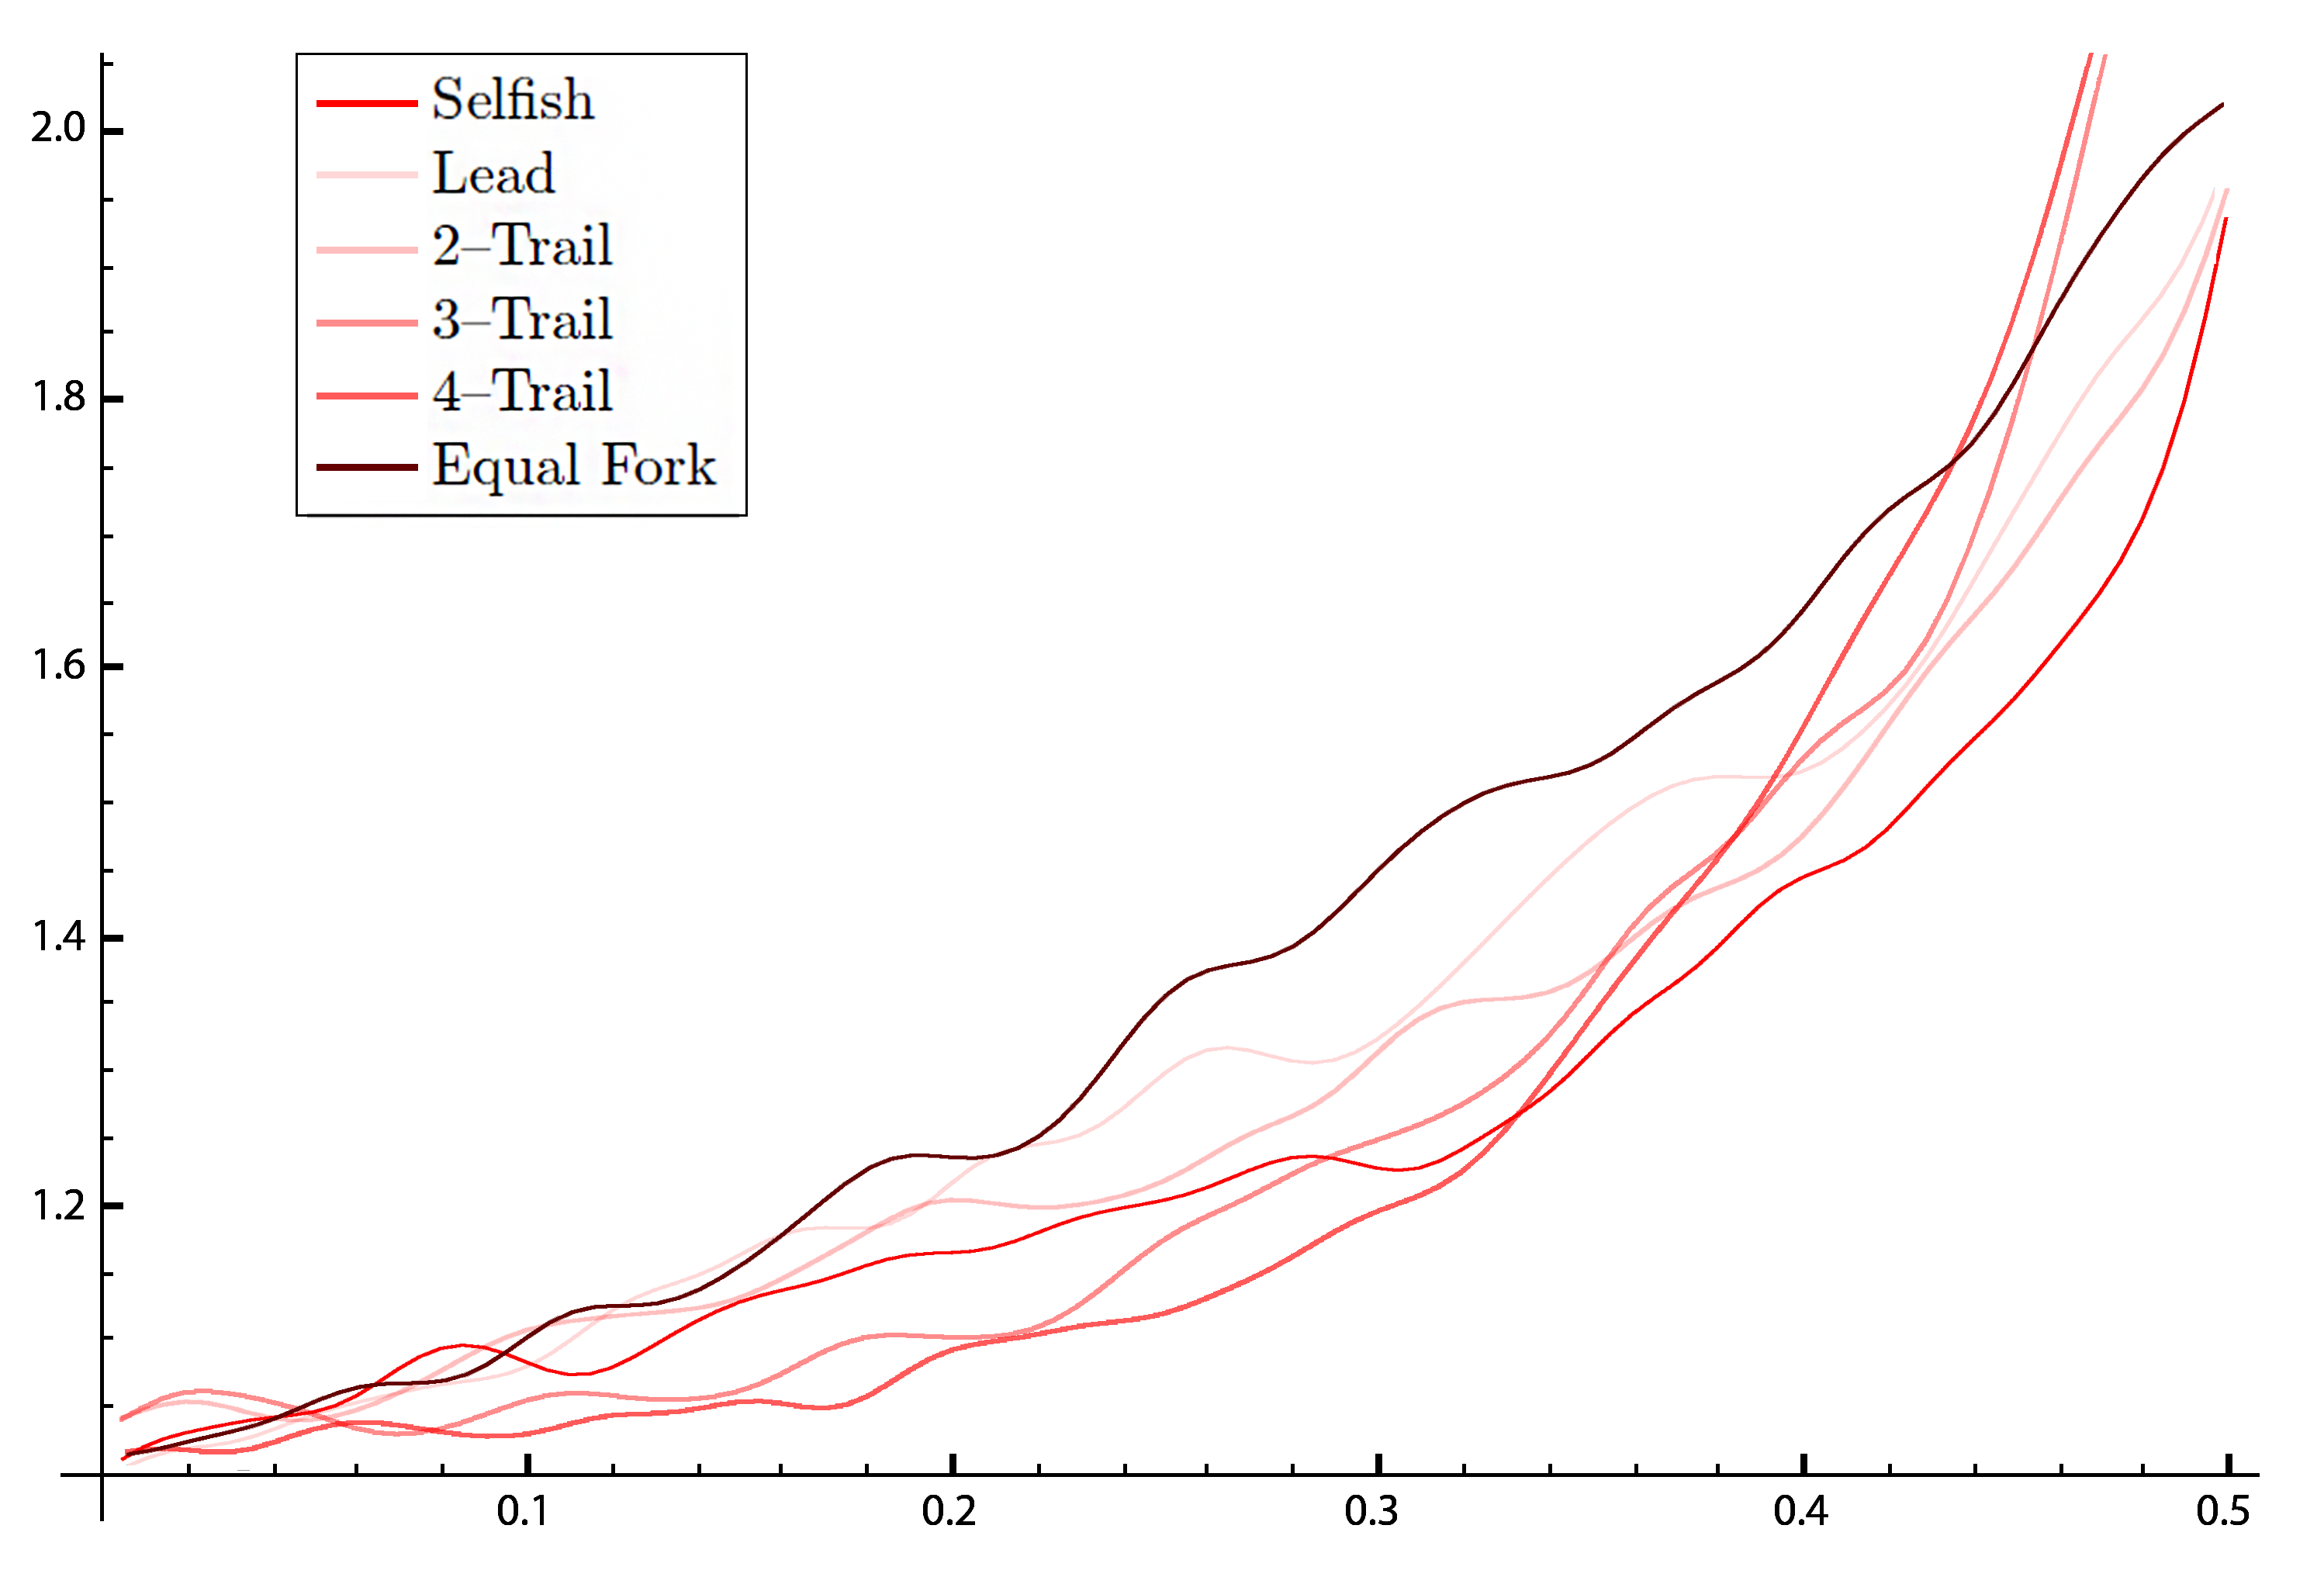
Based on On Profitability of Selfish Mining the difficulty of a pool containing selfish mining is alwasys between 1 and 2, this is exactly the case in our simulation as can be seen in the previous visualizations.
Now we can visualize the minimum time before profitability place on our winner strategy diagrams. This regardless of the value of minimum time before profitability, this way for each value of the hashrate share we can see where the minimum occurs.
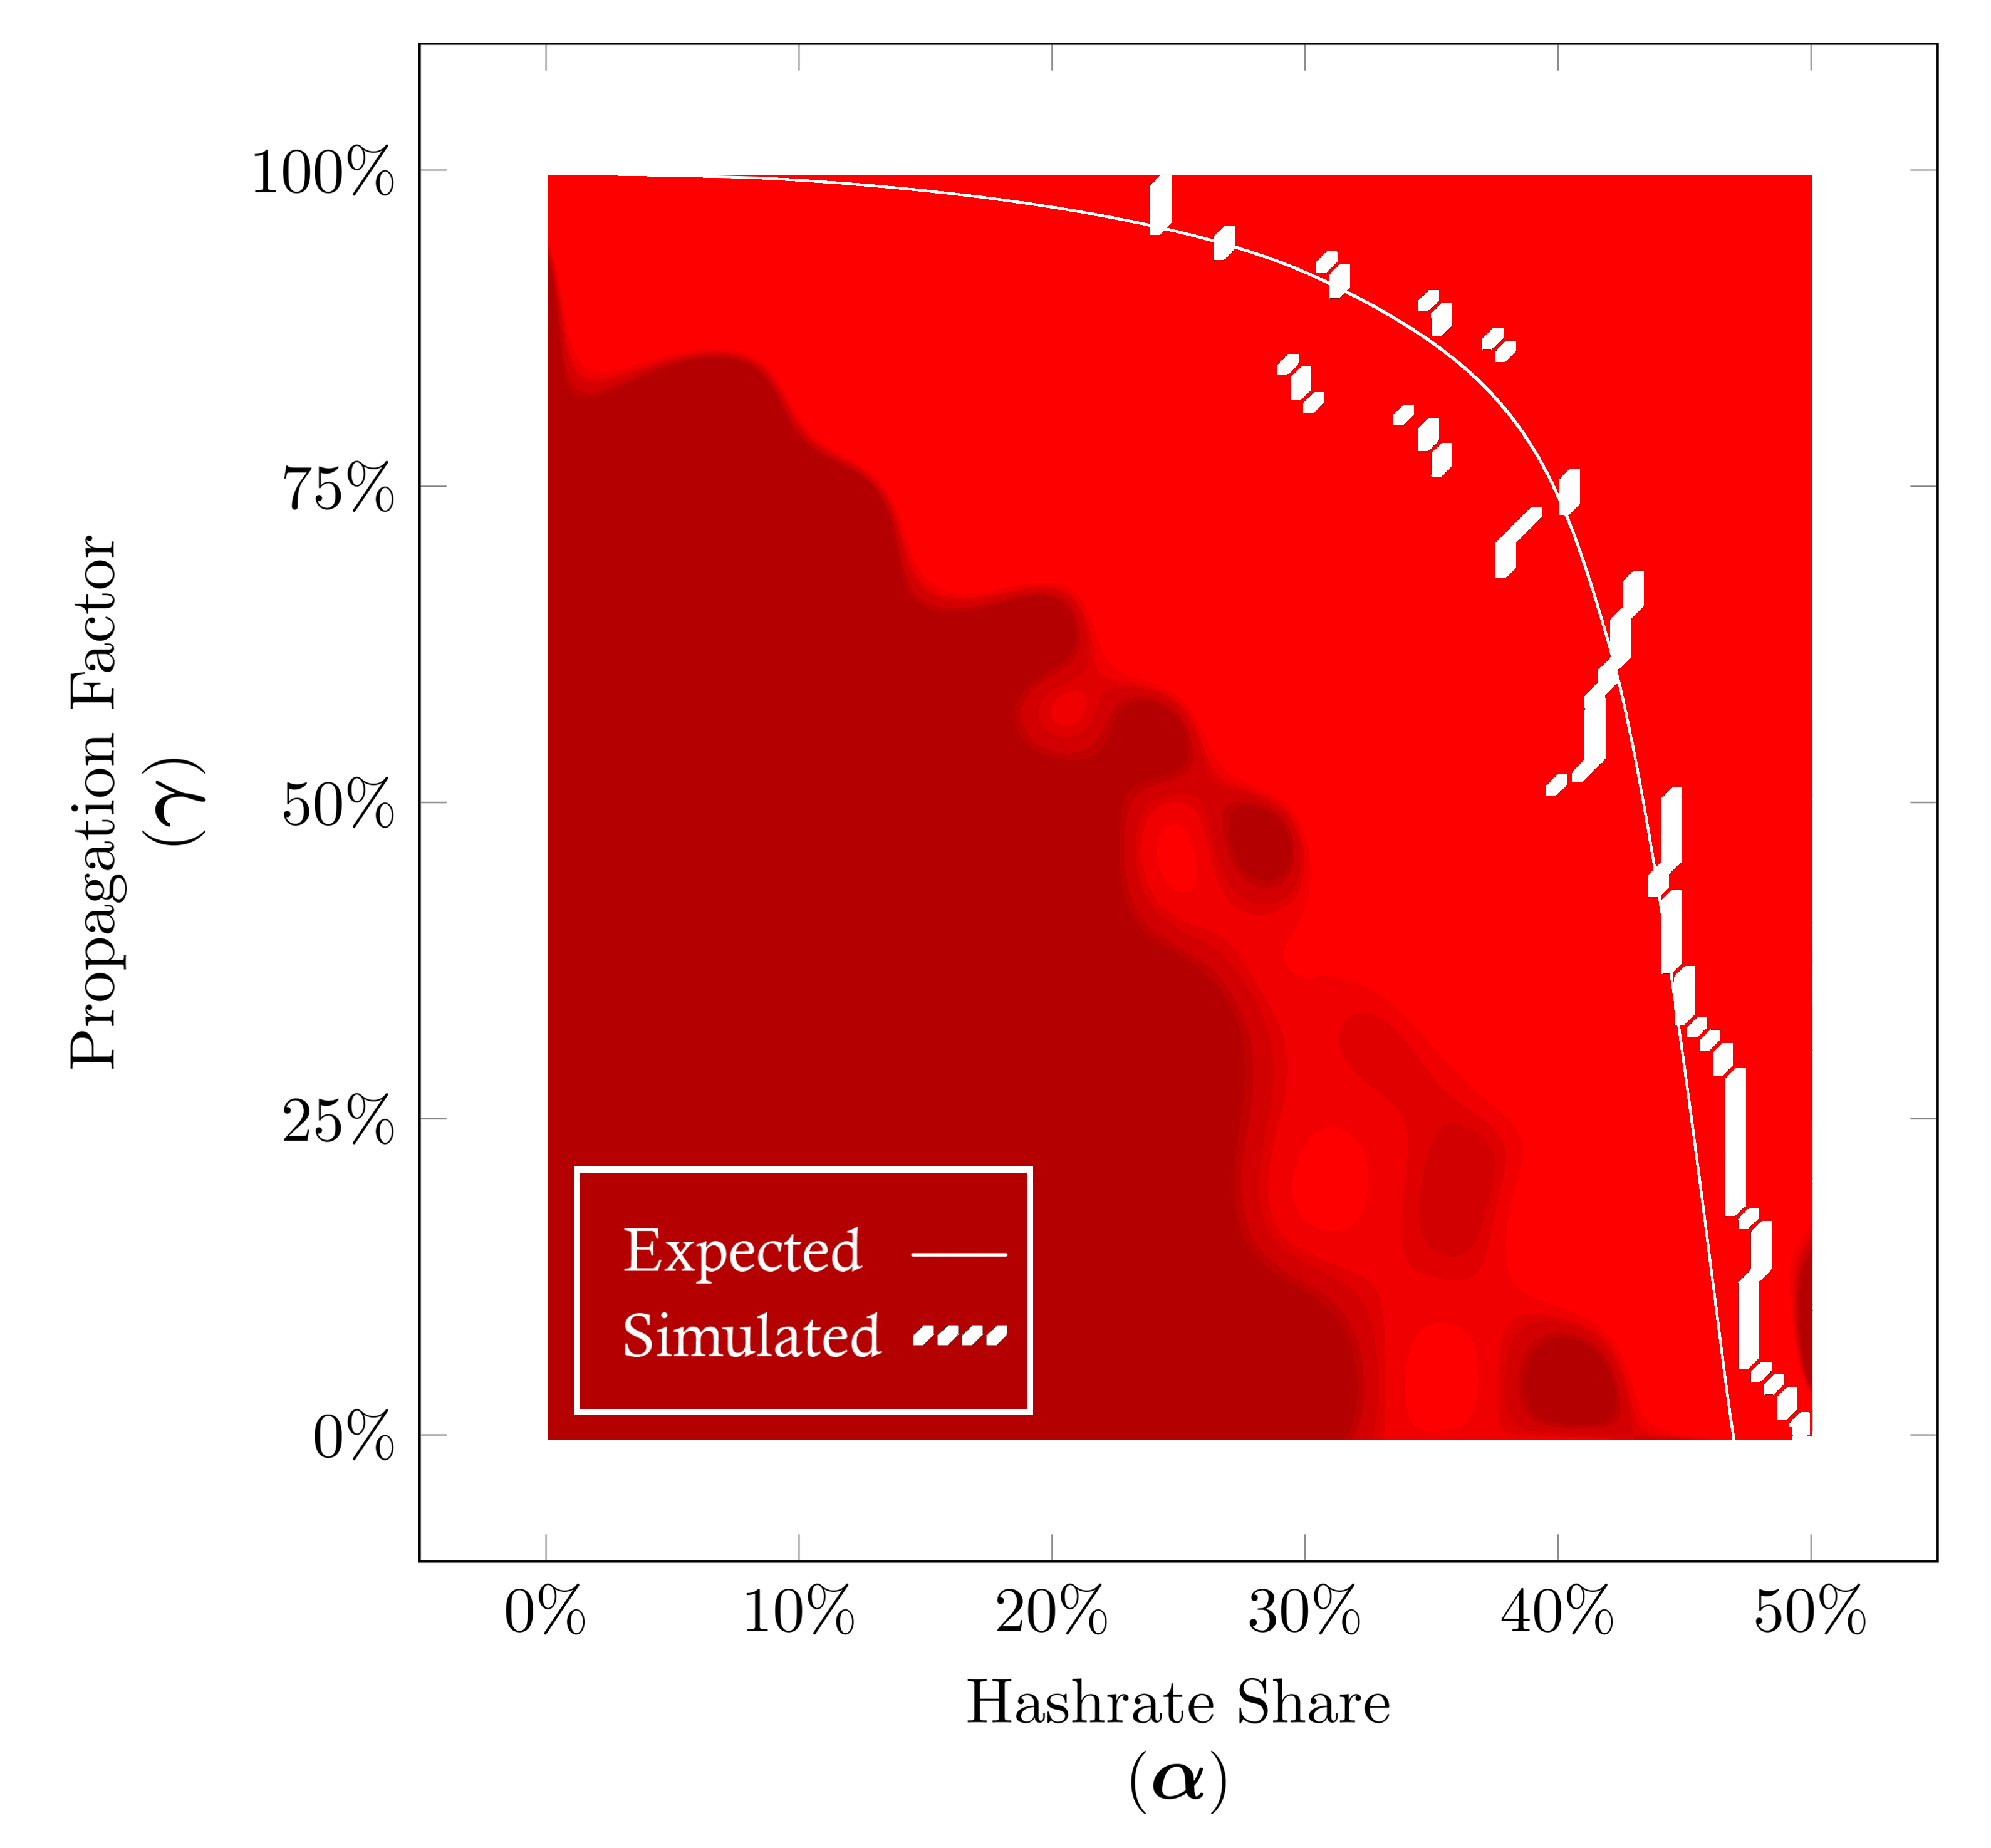
Expected Minimum Time Before Profitablity for Selfish strategy based on On Profitability of Selfish Mining for hashrate shares between 0% to 50% (α∈[0,0.50]).
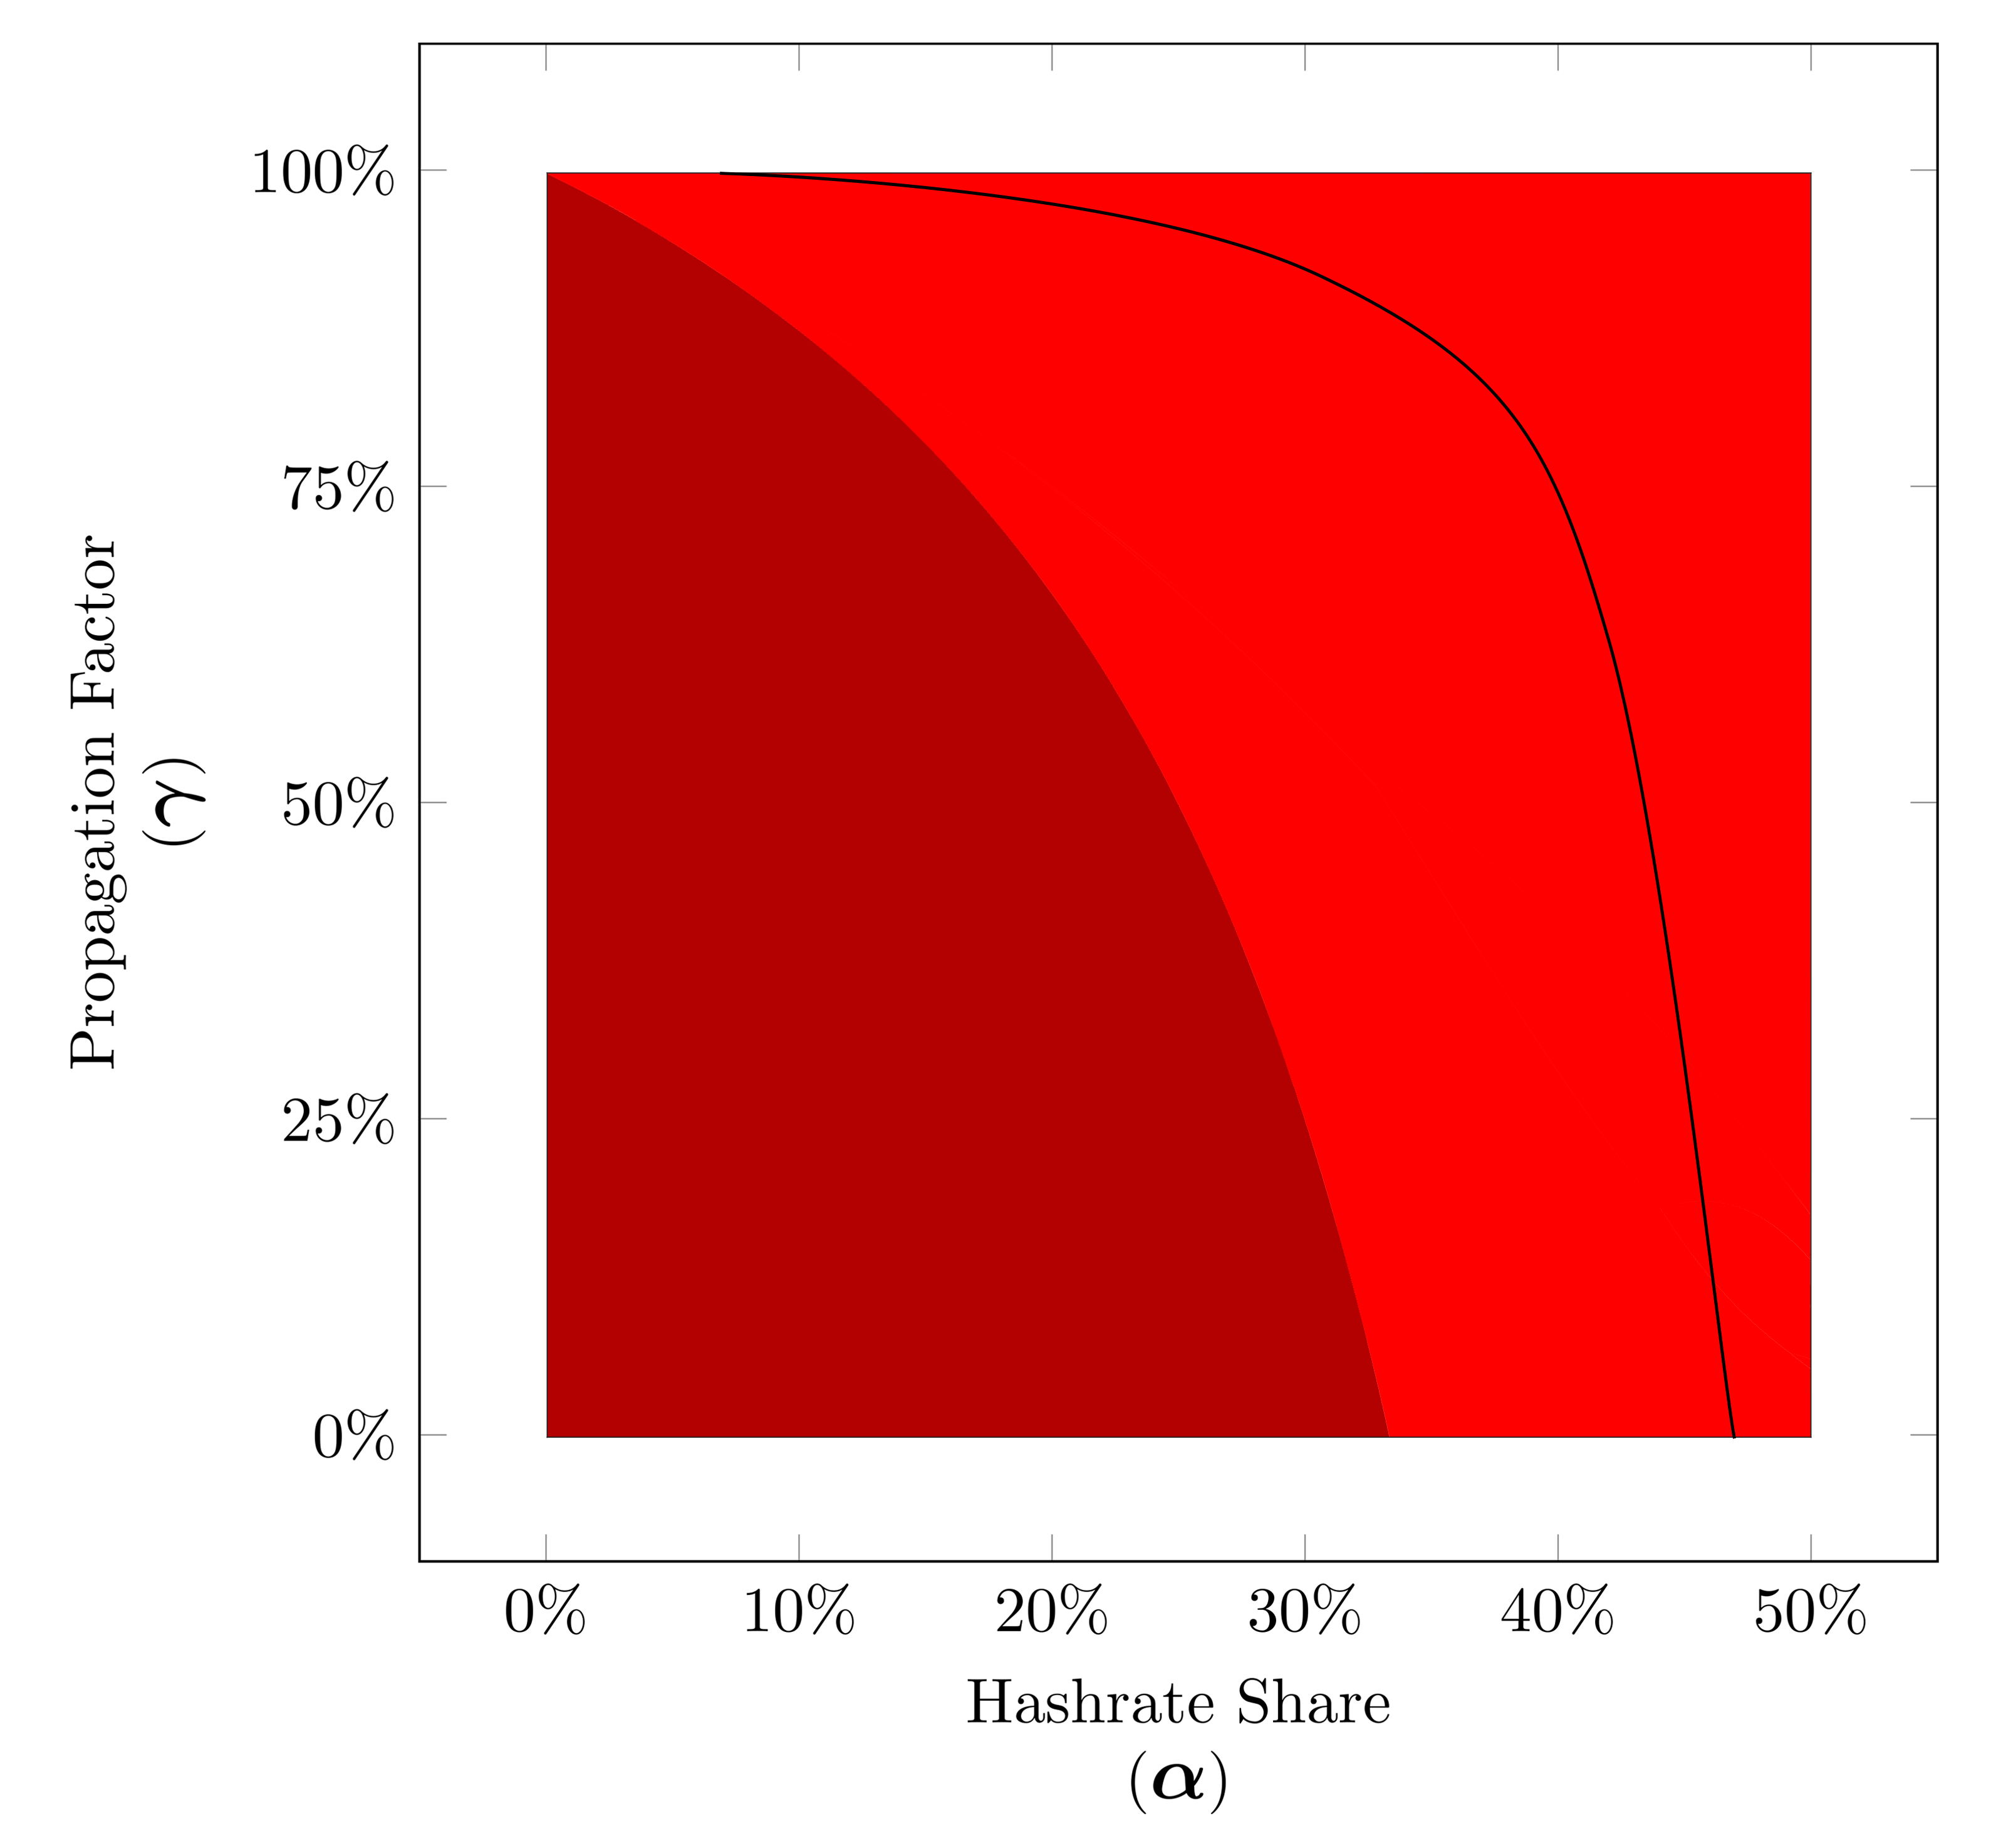
Simulated Minimum Time Before Profitablity for Selfish strategy based on our peer-to-peer network simulation for hashrate shares between 0% to 50% (α∈[0,0.50]).
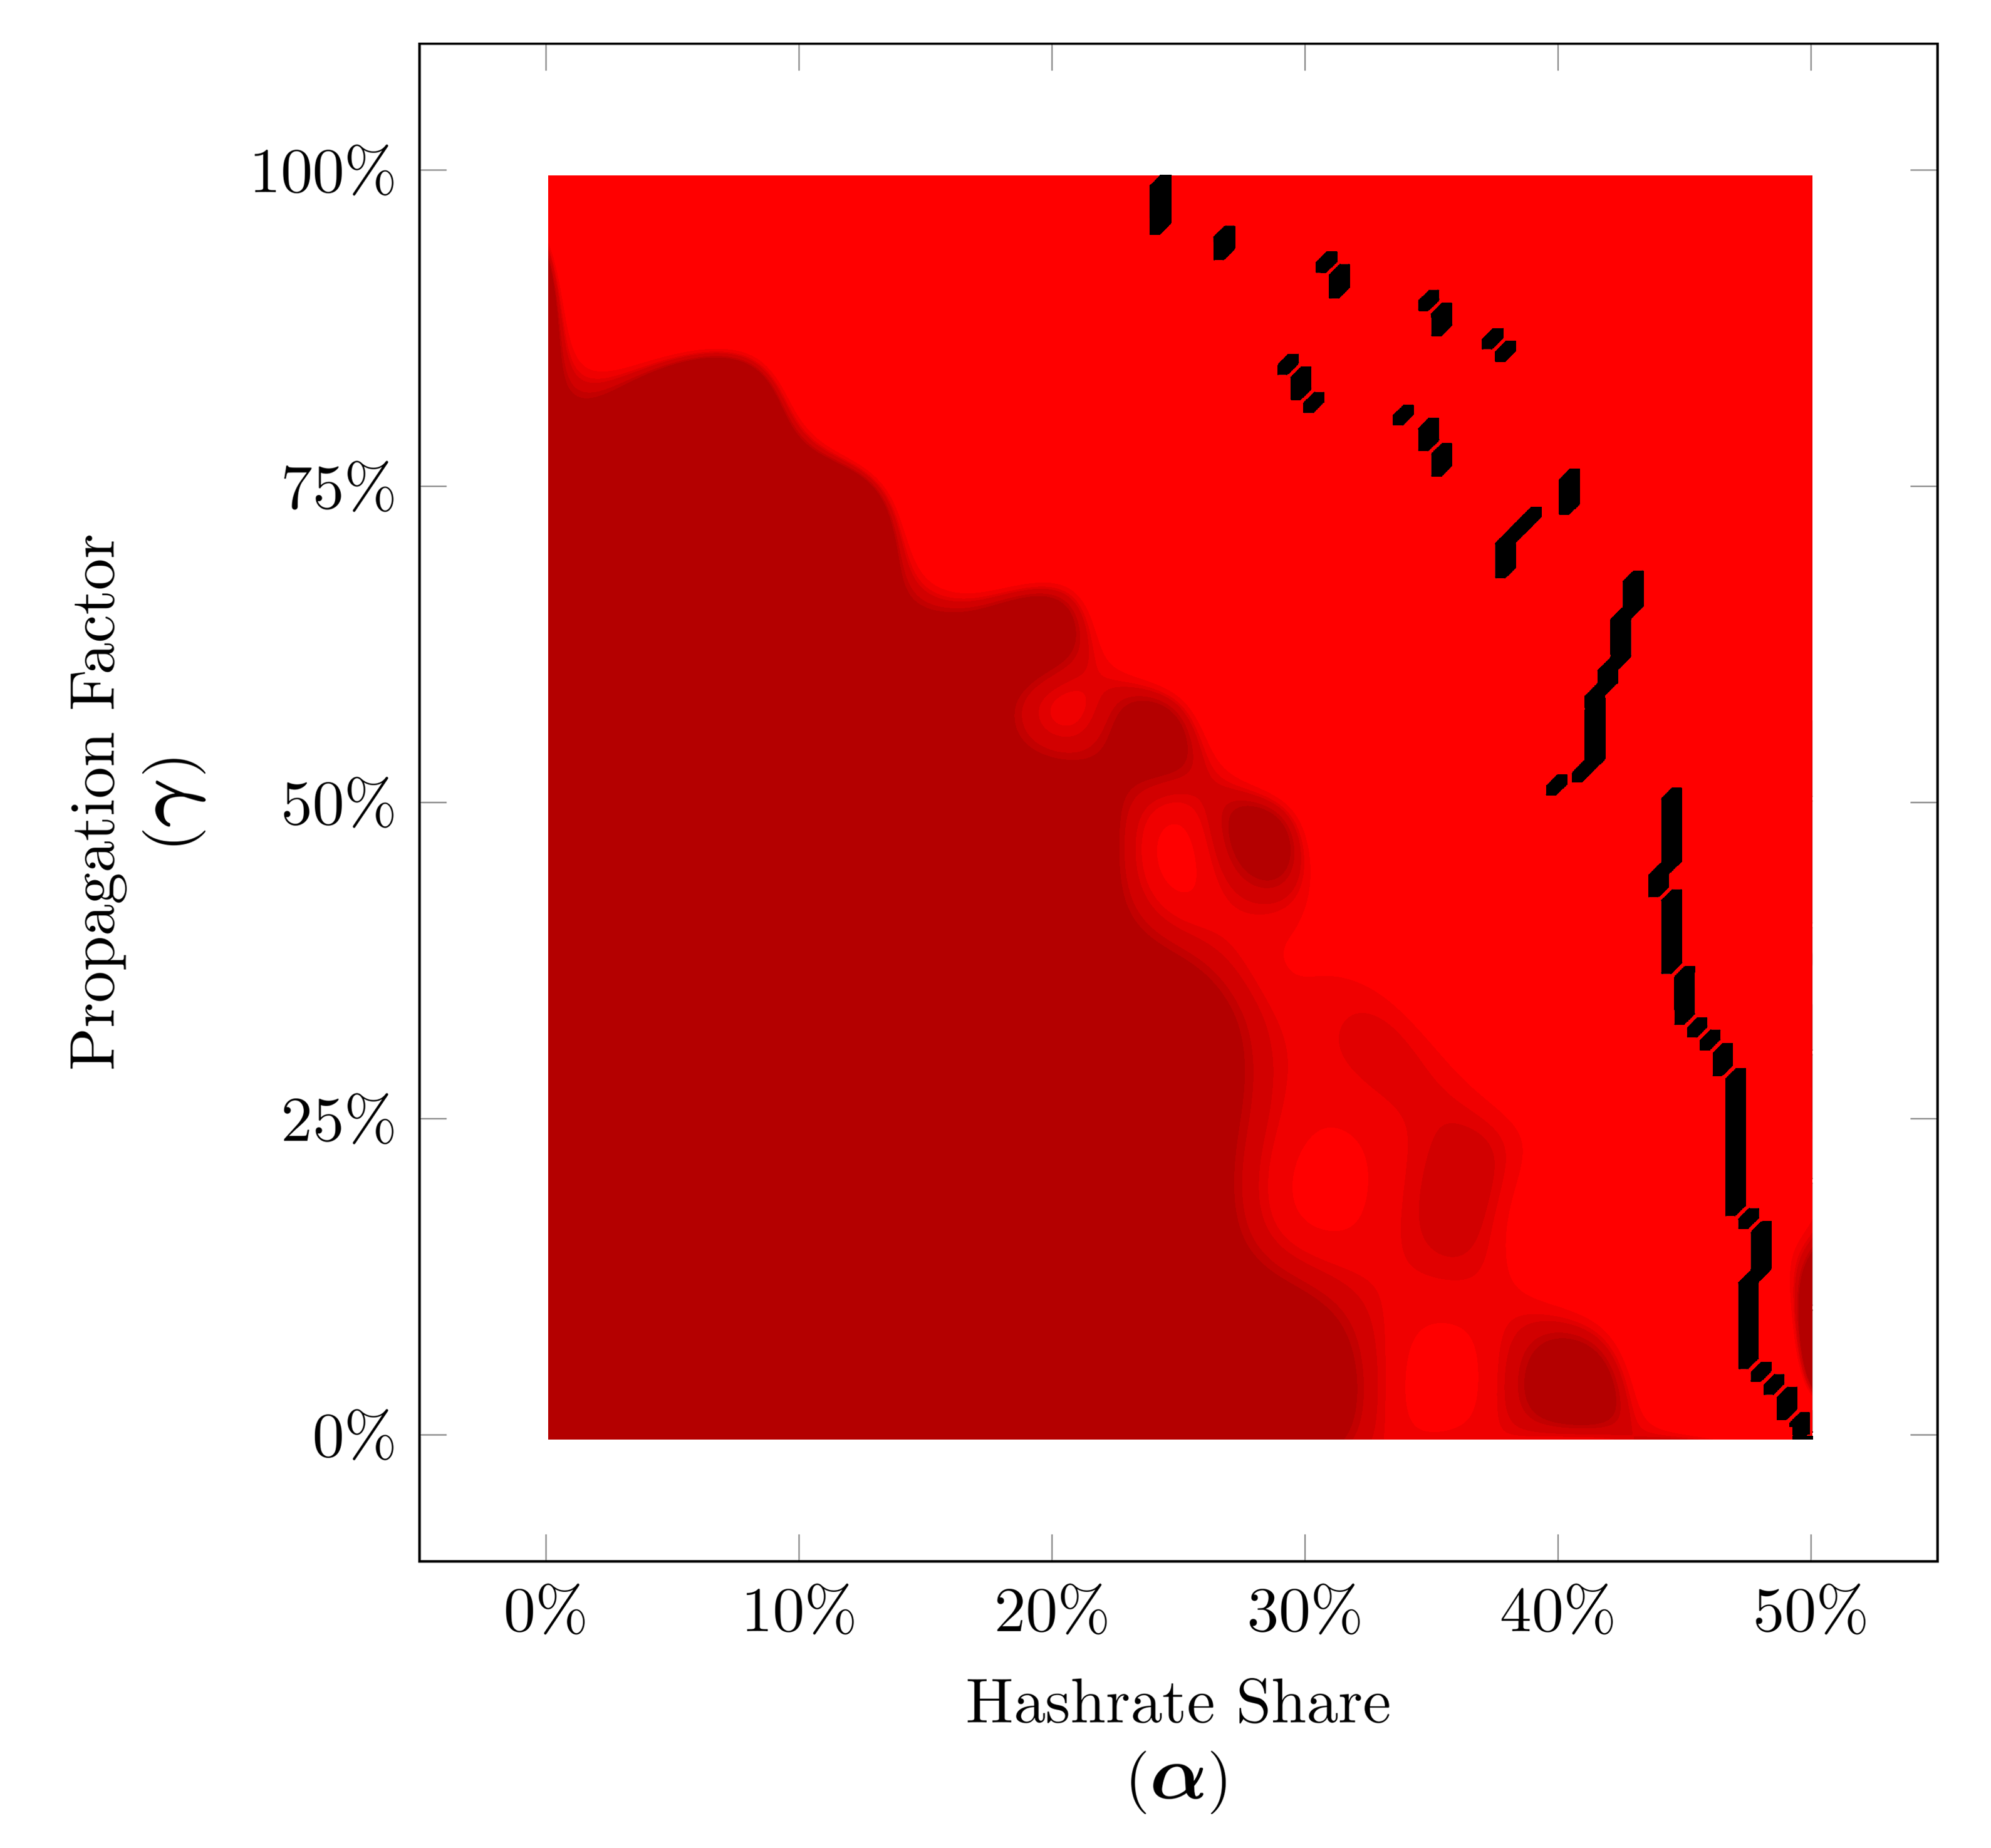
Simulated Minimum Time Before Profitablity for Lead strategy based on our peer-to-peer network simulation for hashrate shares between 0% to 50% (α∈[0,0.50]).
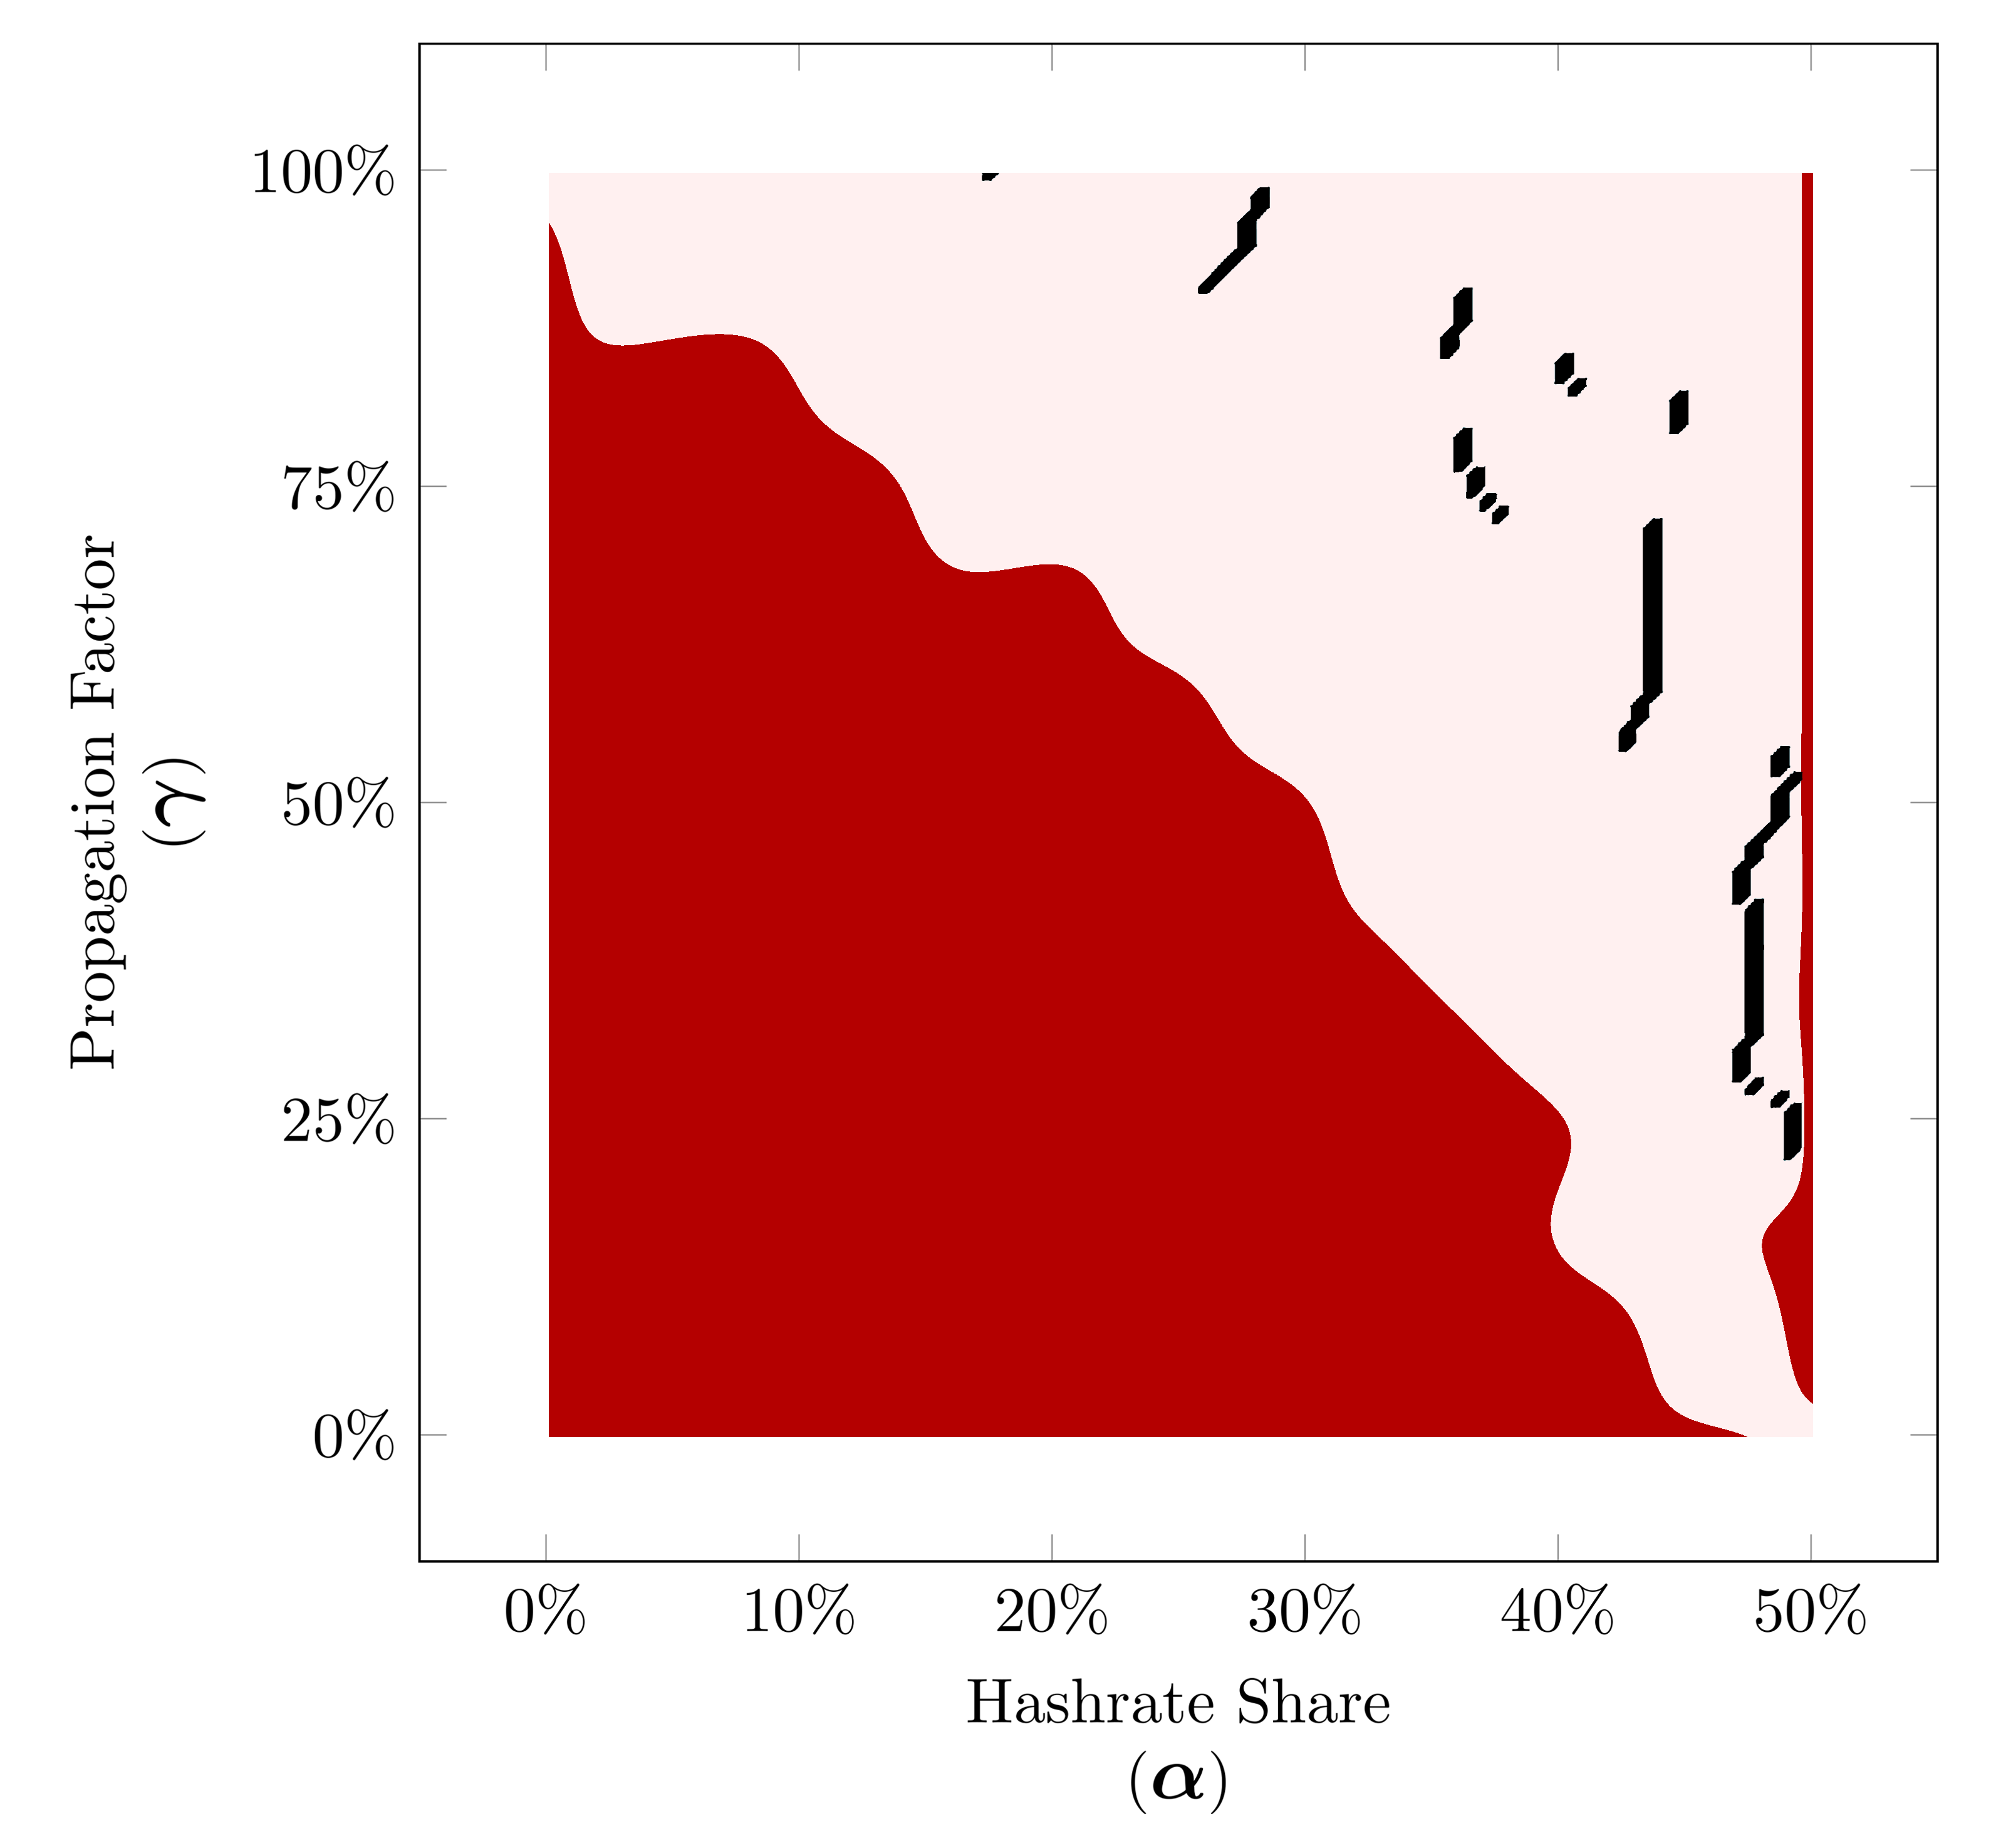
Simulated Minimum Time Before Profitablity for 2-Trail strategy based on our peer-to-peer network simulation for hashrate shares between 0% to 50% (α∈[0,0.50]).
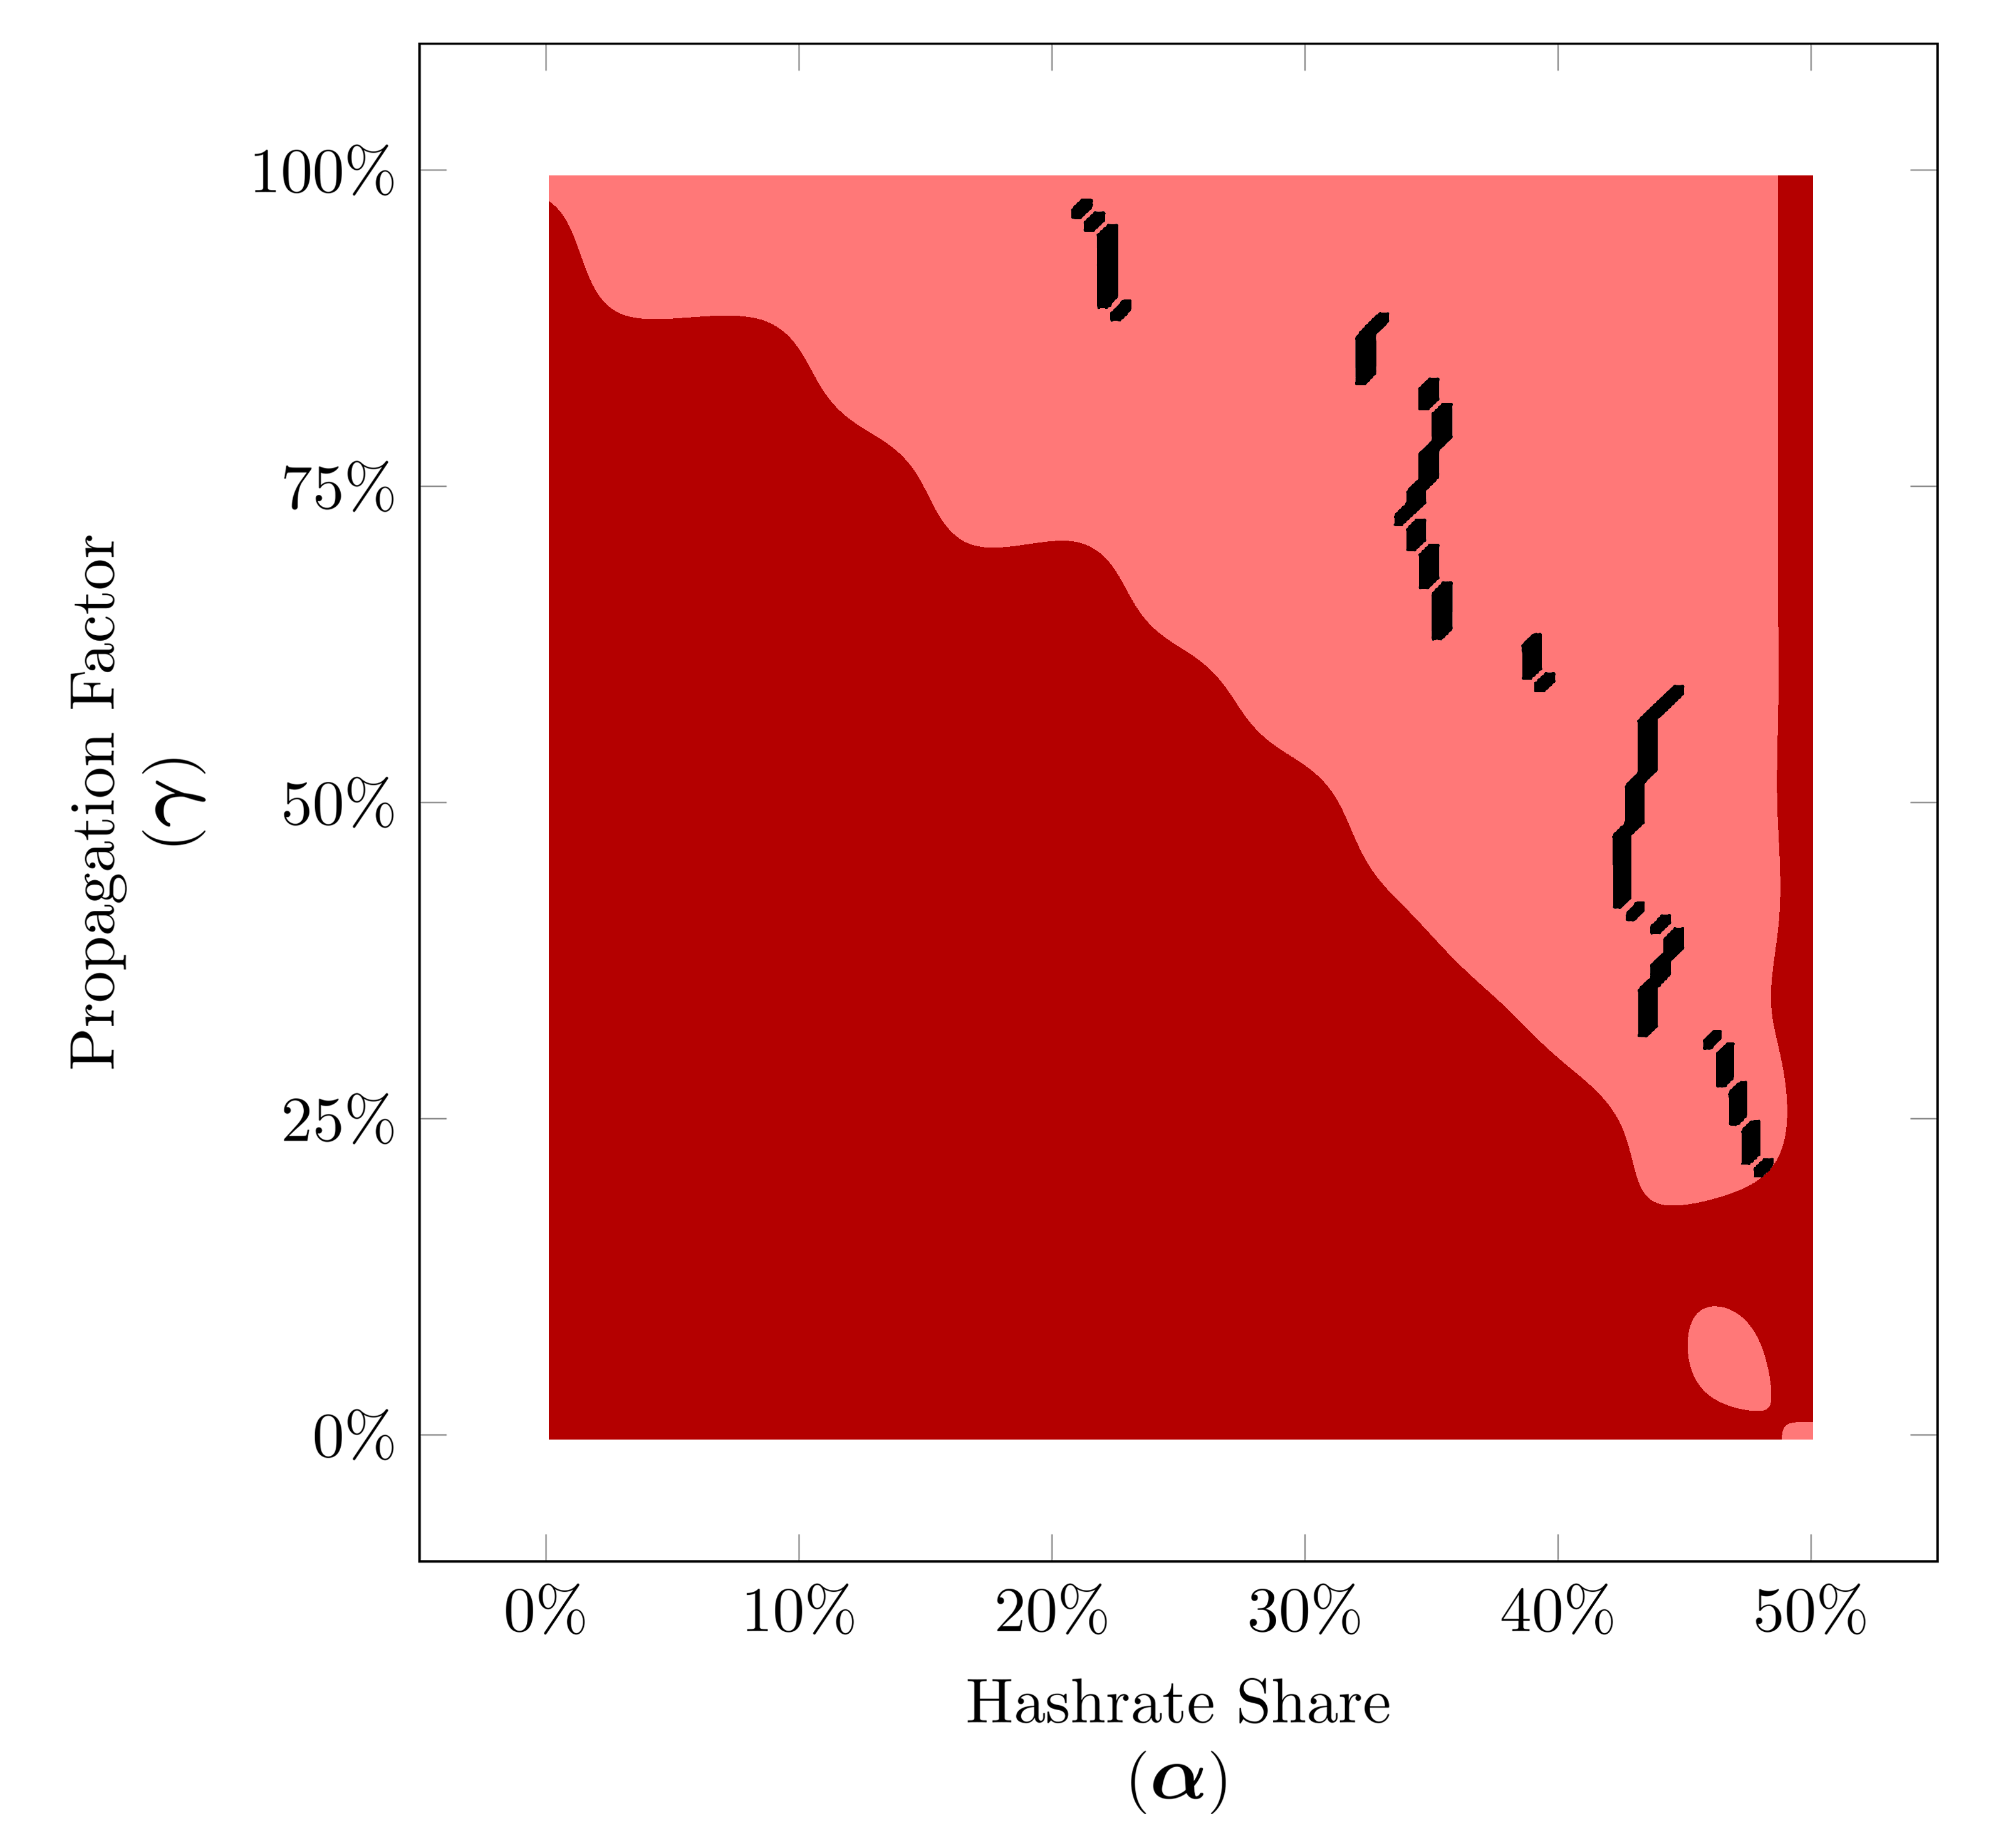
Simulated Minimum Time Before Profitablity for 3-Trail strategy based on our peer-to-peer network simulation for hashrate shares between 0% to 50% (α∈[0,0.50]).
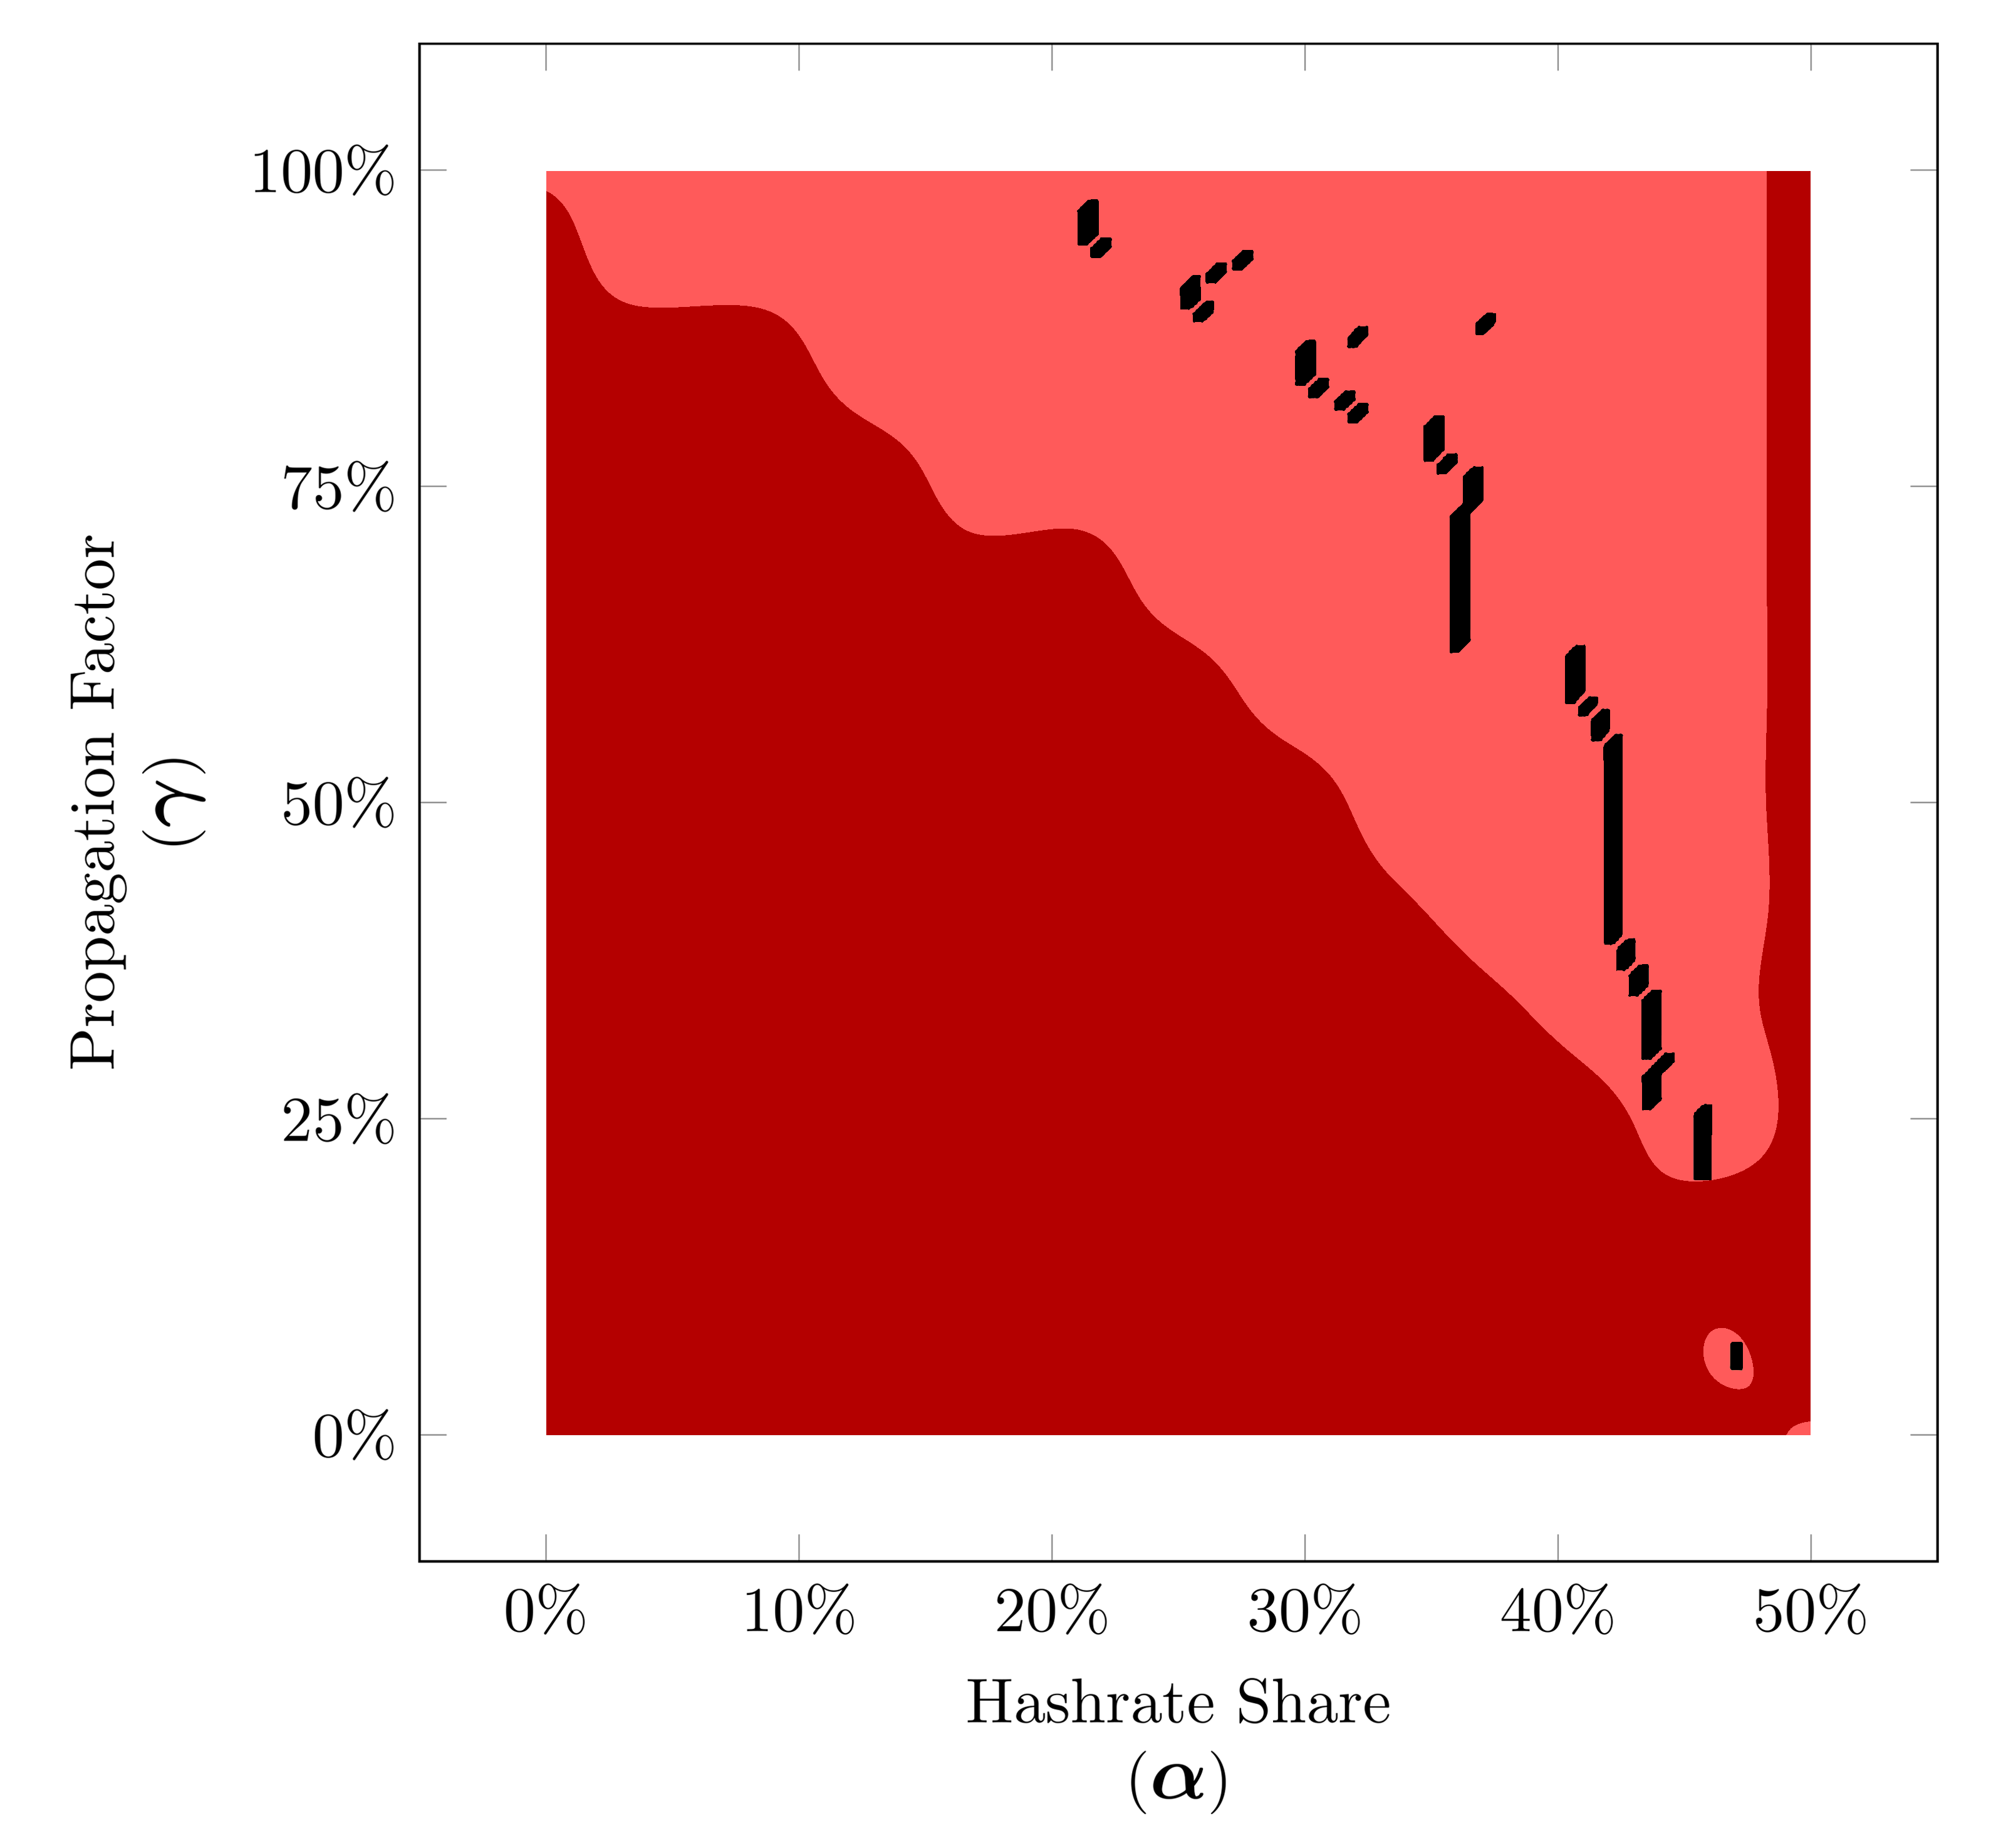
Simulated Minimum Time Before Profitablity for 4-Trail strategy based on our peer-to-peer network simulation for hashrate shares between 0% to 50% (α∈[0,0.50]).
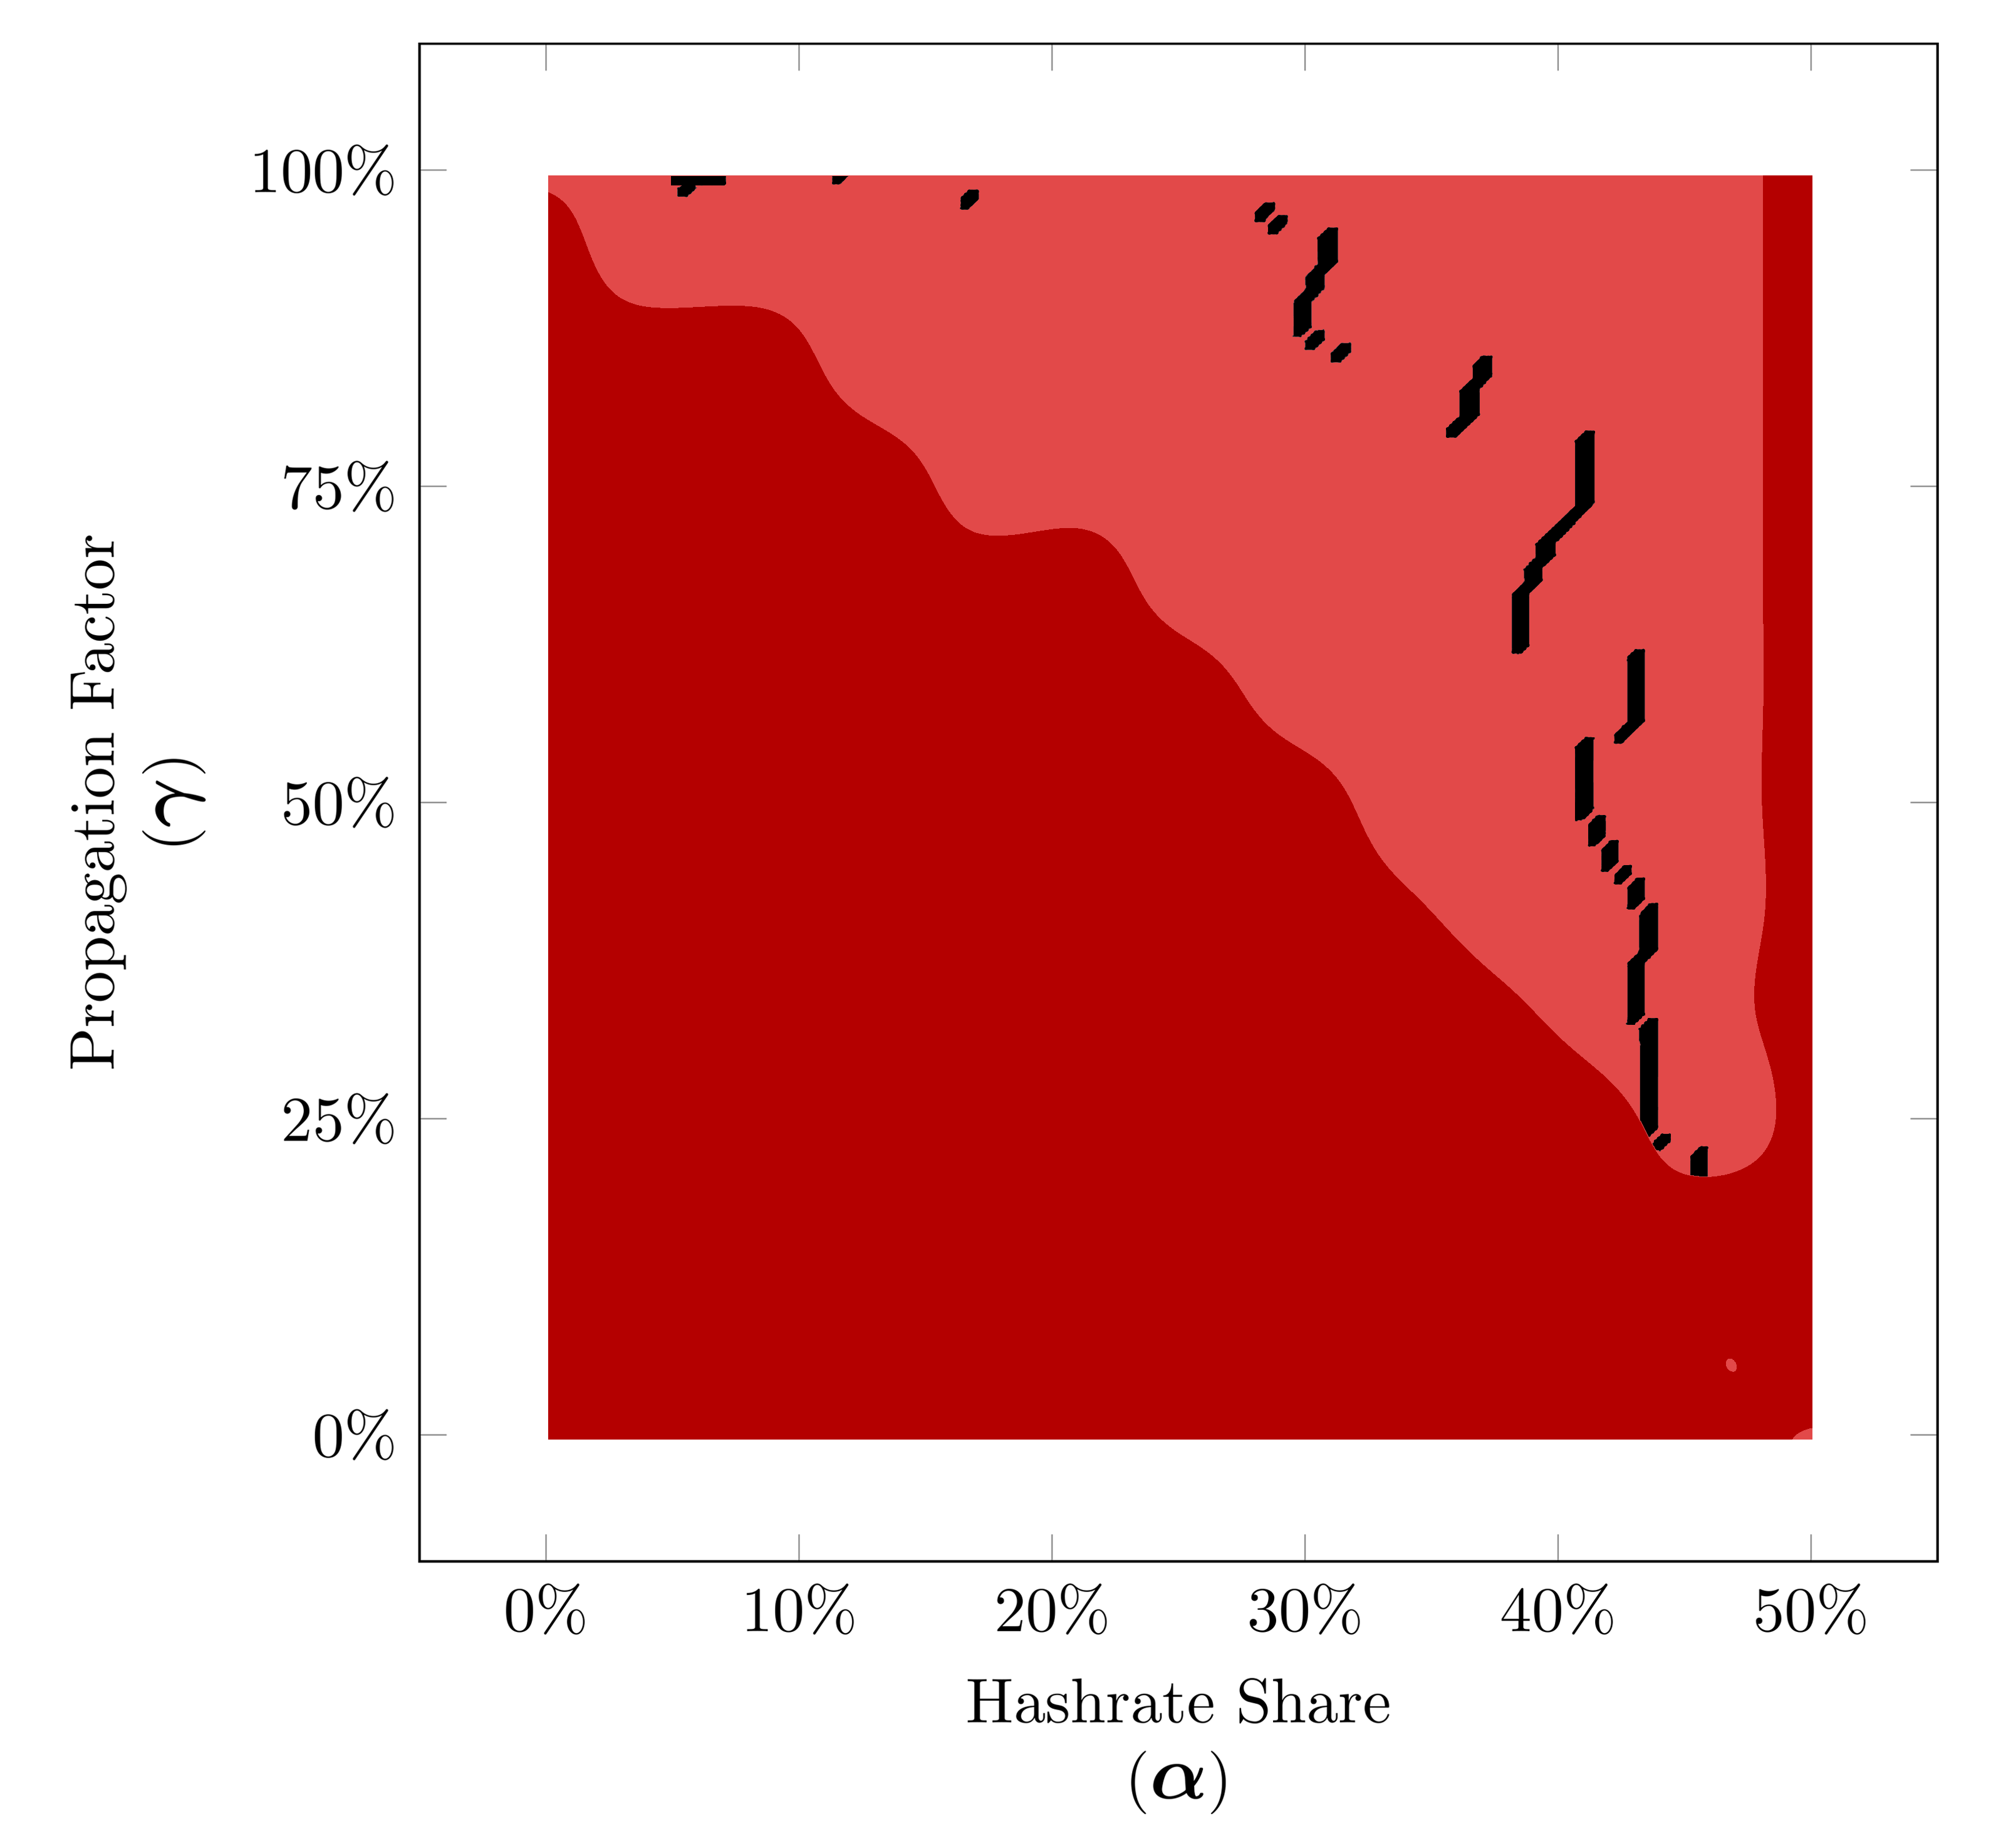
Simulated Minimum Time Before Profitablity for Equal Fork strategy based on our peer-to-peer network simulation for hashrate shares between 0% to 50% (α∈[0,0.50]).
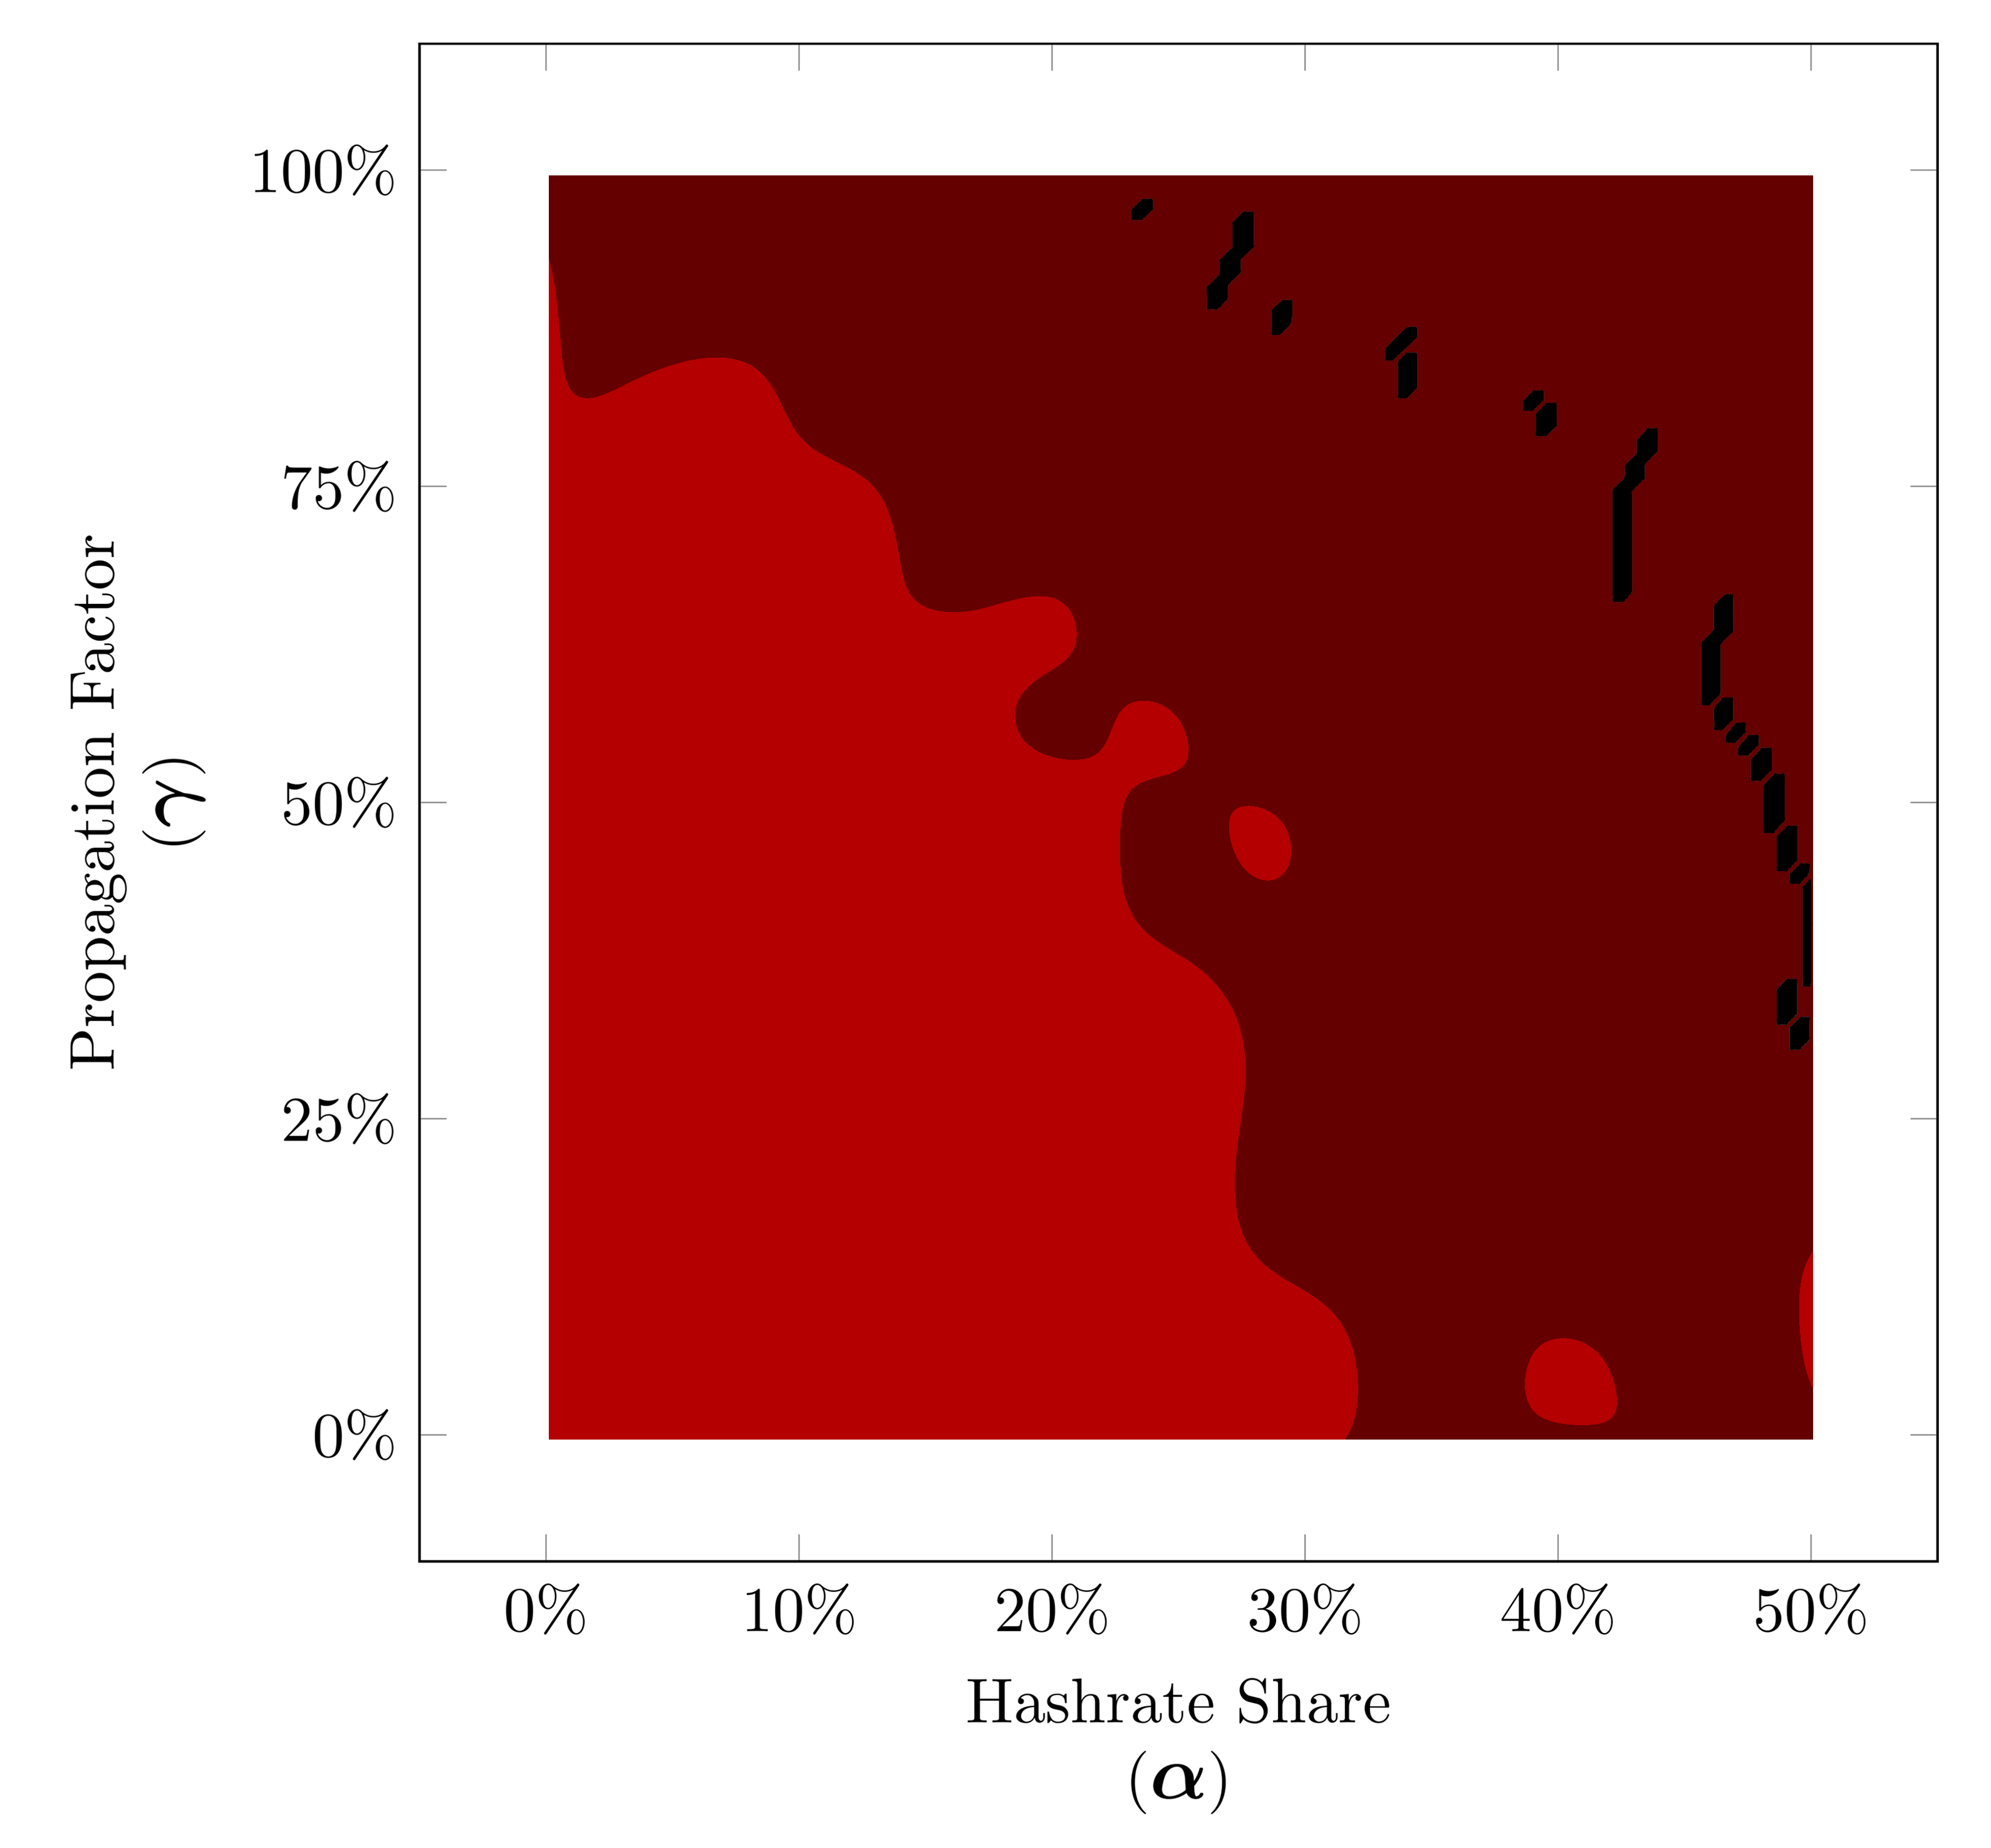
Need more stats?
First you can go back and change the α , γ and n again and click simulate.
POOL STATS
Here you can find some information about the mining blocks of different strategies based on your chosen α , γ and n.
| Honest Mining |
Selfish Mining |
Lead Stubborn Mining |
2 – Trail Stubborn Mining |
3 – Trail Stubborn Mining |
4 – Trail Stubborn Mining |
Equal Fork Stubborn Mining |
|---|
| You Published | |||||||
| Others Published | |||||||
| Total Blocks Published | |||||||
| Orphaned Blocks | |||||||
| Total Blocks Mined | |||||||
| Orphaned Percentage | |||||||
| You Published % of all blocks | |||||||
| Others Published % of all blocks |
PROFITABILITY
Here you can find some information about the apparent hash rate, profitability, difficulty changes and attack duration of different strategies based on your chosen α , γ and n.
| Honest Mining |
Selfish Mining |
Lead Stubborn Mining |
2 – Trail Stubborn Mining |
3 – Trail Stubborn Mining |
4 – Trail Stubborn Mining |
Equal Fork Stubborn Mining |
|---|
| Your Real Hash Rate | |||||||
| Your Apparent Hash Rate | |||||||
| Your Profitability Ratio | |||||||
| Difficulty Changed | |||||||
| Difficulty Will Change To | Attack Cycles Duration |
THEORETICS
Here you can find the expected theoretical values of the apparent hash rate and profitability ratio of different strategies based on your chosen α , γ and n.
For more information click here
| Honest Mining |
Selfish Mining |
Lead Stubborn Mining |
2 – Trail Stubborn Mining |
3 – Trail Stubborn Mining |
4 – Trail Stubborn Mining |
Equal Fork Stubborn Mining |
|---|
| Your Apparent Hash Rate Would Be | |||||||
| Your Profitability Ratio Would Be |
Mathematical formulation.
Although some mathematical formulations for these strategies have been developed before, they usually lack a consideration of the time(duration) of the attack and also the proper analysis of the costs of the attack. For example in Optimal Selfish Mining Strategies in Bitcoin selfish mining strategies are considered to be optimal. The same goes for some textbooks like Bitcoin and Cryptocurrency Technologies and Distributed Ledger Technology: The Science of the Blockchain .
In contrast in year 2018 three articles On Profitability of Selfish Mining , On Profitability of Stubborn Mining and On Profitability of Trailing Mining were published providing a deep and comprehensive study on these strategies.
Let's take a look at some parts of the these articles.
As you know
- is your hash rate share of the network.
- is the others' hash rate share of the network ( ) .
- is the relative hashing power of the attacker ( ) .
- is the proportion of honest miners who mine on the fork you created.
you should also know
- is the reward for finding a block.
- is the average inter-block validation time (which is around 10 minutes for bitcoin).
now we define
- as your Apparent Hash Rate (find the definition below).
- as your Profitability Ratio (find the definition below).
First of all your Hash Rate ( ) means that we expect in the long term the average proportion of blocks mined by you would be also . Then since you are adapting a selfish or stubborn strategy the average proportion of blocks mined by you could be different than so we define your Apparent Hash Rate ( ) which is a function of and . On the other hand Profitability Ratio ( ) is a function of , , and which is the benchmark for the comparison of different strategies, more precisely, strategy is more profitable than strategy if and only if .
For example profitability ratio of selfish mining strategy (
) has different values before and after difficulty adjustment:
This fact also holds for apparent hash rate of selfish mining strategy (
) :
The reason for that as described in the article is:
“The protocol underestimates the real hashing power in the network since only the blocks that are in the (offcial) blockchain are taken into account. The number of orphan blocks grows in the presence of a selfish miner and a significant amount of honest hash rate is lost. The average time used by the network to validate blocks increases. After 2016 blocks, a difficulty adjustment is done automatically ignoring the production of orphan blocks. Despite the fact that the total hashing power of the network remains the same, the new difficulty is lower than it should be, and the block validation time decreases. So the revenue per unit of time of the selfish miner improves and makes the attack profitable.”
Here you can find profitability ratio and apparent hash rate of different strategies:
( hm | Honest Mining Strategy,
sm | Selfish Mining Strategy,
lsm | Lead Stubborn Mining Strategy,
j–tsm | j–Trail Stubborn Mining Strategy,
efsm | Equal Fork Stubborn Mining Strategy. )
In Equal fork stubborn mining is generating series for Catalan numbers and is the n-th Catalan number
In j–trail stubborn mining and
Read more.
If you are intrested in these stuff, here is some links for you :
For selfish mining this is probably the best source.
For stubborn mining this is the best source.
For mathematics of selfish mining this is the best source.
For mathematics of stubborn mining this and this are absolutely the best sources.
Contact.
Do you have any question?
makh.khosravi@gmail.com
mohammad.khosravi@devinci.fr
mohammad.khosravi@studenti.unipd.it

